Kevan W. Lamm, University of Georgia, kl@uga.edu
Hannah S. Carter, University of Florida, hcarter@maine.edu
Abstract
When asked about the benefits of participating in agriculture and natural resource (ANR) leadership development programs, one of the most frequent responses is the network one can develop. However, despite the ubiquity of the perceived benefit there have been few empirical studies conducted to examine network development within ANR leadership development programs. With improved social network data capture and analysis techniques, contemporary ANR leadership development programs, and leadership educators more generally, are well-positioned to take advantage of these developments. The results of the current study indicate social network analysis is an appropriate tool for establishing evaluative measures of network emergence and development within ANR leadership development programs.
Introduction
When asked about the benefits of participating in agriculture and natural resource (ANR) leadership development programs, one of the most frequent responses is the network one can develop (e.g. Kelsey & Wall, 2003). However, despite the ubiquity of the perceived benefit there have been few empirical studies conducted to examine network development within ANR leadership development programs. From an educational perspective, ANR leadership development programs also represent non-traditional composite learning environments and typically include both formal and non-formal educational components (Kaufman, Rateau, Carter, & Strickland, 2012).
At the most fundamental level, leadership is about interactions between people. Northouse (2013) has defined leadership as, “a process whereby an individual influences a group of individuals to achieve a common goal” (p. 5). Leadership development programs therefore should naturally encourage and enable the development of these connections between participant learners. However, one of the critiques of leadership development programs more generally is a lack of rigor and accountability related to outcomes and impacts (Kellerman, 2012). Consequently, there seems to be a persistent challenge to quantify and empirically report what is more tacitly experienced by participant learners.
As social creatures (e.g. Ryan & Deci, 2000), humans and the interactions between oneself and others is a fundamental aspect of humanity (Bass, 2008). Social networks are a natural extension of this shared experience. ANR leadership development programs are generally composed of cohorts of individuals sharing common experiences and interacting throughout the program (Kaufman et al., 2012). Based on Bandura’s Social Learning Theory (1977) it has been established part of the learning process is conditional on the shared learning experience amongst participants. From a social interaction perspective, the connections between individuals is paramount, “what happens to a group of actors is in part a function of the structure of connections among them” (Borgatti, Everett, & Johnson, 2018, p. 1).
With improved social network data capture and analysis techniques, contemporary ANR leadership development programs, and leadership educators more generally, are well-positioned to take advantage of these developments. With more sophisticated techniques available to measure, monitor, and evaluate social network, educators can be more responsive to the needs of learners (McKeachie & Svinicki, 2013). Furthermore, social network data can provide additional evaluation data educators can use to quantify the ANR leadership development program experience and outcomes
Priority area five of the National Research Agenda: American Association for Agricultural Education 2016 – 2020 (Roberts, Harder, & Brashears, 2016) addresses efficient and effective agricultural education programs with a particular focus on, “What evaluation methods, models, and practices are effective in determining the impacts of educational programs in agriculture and natural resources?” (p. 43). The purpose of this research is to present an evaluation approach and methodology for capturing and reporting leadership development programming impacts and outcomes, specifically the emergence and composition of networks among program participants.
Conceptual Framework
The conceptual framework for this study was based on social capital (Coleman, 1988) and social networks (Borgatti, Mehra, Brass, & Labianca, 2009). The integration of the two theory bases is intended to provide both a theoretical basis for phenomenon to occur, in this case social capital preceding network emergence, and a theoretical framework in which to quantify the outcome, social networks.
Social Capital
As Coleman (1988) established, social capital plays a significant role in human capital development. An individual amasses network connections and assets, these assets are then available to employ when appropriate (Burt, 2009). Network assets, or social capital is thus comprised of both strong and weak connections throughout a network (Lin, 2008). Additionally, social capital is composed of norms within a network to facilitate mutual understanding and expectations (Woolcock & Narayana, 2000).
Fundamentally, social capital may be considered to be a measure of informal power among a heterogenous group, or network (Bass, 2008). Although an individual with a higher level of social capital may not hold a formal position of authority within a network, such an individual is generally viewed as holding a degree of influence and access to resources beyond those of their peers (Rogers, 2003). More specifically, “the concept of social capital refers to the ways in which people make use of their social networks in getting ahead.” (Hsung, Lin, & Breiger, 2010, Location No. 319).
Within the literature, social capital has been examined extensively. Stemming from the seminal works of Coleman (1988) and Lin, Fu, and Hsung (2001), social capital remains a relevant theory base for inquiry and analysis. For example, Mollenhorst, Völker, and Flap (2008), examined the relationship between social contexts and building personal networks. According to the researchers the place where people meet their network members is important to the resulting relationship. Additionally, Erickson (2004) found within the context of a local community organization engaged in the sale of goods and services amongst the group that social capital accrued at the local level had a relationship with social capital at a higher order level. Consequently, the existence of social capital locally within the organization was related to more social capital outside of the organization, in the community at large.
Social Networks
Although contemporary social network analysis is done within the context of methodological rigor, social networks should not be confused with a methodology. Instead social networks are a representation of social phenomenon grounded in theoretical concepts intended to explain the social world (Borgatti & Halgin, 2011). Humans, and social interactions amongst humans, are complex based on the multitude of variables that may influence such interactions. However, despite the acknowledged challenges associated with observing and quantifying interactions, social network analysis has been employed widely to capture and analyze the phenomenon (Borgatti et al., 2009).
For example, Johnson, Boster, and Palinkas (2003), analyzed small group development among individuals. From an organizational interaction perspective, Lamm and Lamm (2017) examined the nature of relationships between funding agencies as reported by Biological Science educators. Additionally, Scott, Jiang, Wildman, and Griffith (2017), analyzed the emergence and of leadership networks in teams as well as the effectiveness of such networks. As it relates to leadership and social networks, Chrobot-Mason, Gerbasi, and Cullen-Lester (2016) analyzed the relationship between organizational identity and leadership identification, finding “individuals who identify strongly with their organization and team are more likely to see others as sources of direction, alignment, and commitment” (p. 307).
Purpose & Research Objectives
The purpose of this study was to analyze social network characteristics of an ANR leadership development program. The study was driven by the following research objectives:
- Describe the nature of existing relationships amongst class members.
- Describe the nature of advice seeking within network.
- Describe the nature of support seeking within network.
- Describe the nature of industry decision influence within network.
- Describe the nature of industry influence within network.
Methods
A social network research design was employed for this study, specifically a whole-network design. An online questionnaire was developed based on recommendations within the literature (Borgatti et al., 2018). The questionnaire was developed for the purposes of the research and reviewed by a panel of experts to ensure content and face validity.
The questionnaire was sent to all 30 of the leadership development program participants in September 2016, prior the first session of the program. The timing was intentional to establish a robust baseline network measure and to minimize the effects of in-person interactions which occur after the program began (Borgatti et al., 2018). There were 29 responses for a 97% response rate. Consistent with the recommendations within the literature (Bono & Anderson, 2005), respondents were first asked to indicate whether they knew each of the 29 other class participants. All results from the analysis replaced respondent names with an ID number placeholder to preserve anonymity (Borgatti et al., 2018).
Next, respondents were asked how likely they were to seek advice from each of their classmates. There were two items used to assess advice. First, “If you needed help, you would seek advice from this person.” Second, “You would seek support from this person if you wanted to implement a new idea.” The items were adapted from sources previously established within the literature (e.g. Bono & Anderson, 2005; Ibarra, 1993; Salk & Brannen, 2000). Individuals indicated their response on a five-point, Likert-type scale. Possible responses to each item included: 1 – Strongly Disagree, 2 – Disagree, 3 – Neutral, 4 – Agree, 5 – Strongly Agree. Consistent with recommendations within the literature (Borgatti et al., 2018) scores were then converted to a dichotomous scale to facilitate analysis. Scores of 4 or 5 were coded as 1 and all other scores were coded as 0.
To examine influence within the network two questions were asked. First, “This person has a great deal of influence on the decisions that get made in your industry.” Second, “This person has a great deal of influence on what happens in your industry.” The items were adapted from sources previously established within the literature (e.g. Bono & Anderson, 2005; Brass & Burkhardt, 1993; Salk & Brannen, 2000). Participants responded to these questions for each classmate, using the same 5-point scale used for advice–likelihood. Consistent with recommendations within the literature (Borgatti et al., 2018) scores were then converted to a dichotomous scale. Scores of 4 or 5 were coded as 1 and all other scores were coded as 0.
The Ucinet 6 software package was used to visualize the network. Nodes represent participants and the lines connecting them indicate an individual (or multiple individuals) have a relationship. Node color is based on participant sex as reported by the participant. Blue indicates a male and pink indicates a female. Node size is determined by centrality within the network. Larger nodes indicate a more central location within the network. Line color is an indicator of whether the connection is reciprocal or one-way. Reciprocal relationships are displayed in red whereas one-way relationships are displayed in grey.
Results
Visualization of Existing Relationships amongst Class Members
Using the Ucinet 6 software package, the network of pre-existing known relationships amongst class members was visualized. A complete network map is provided in Figure 1. Within the group there were three individuals who did not have any pre-existing connections to other class members. Additionally, there was one pair of isolates only connected to each other, as well as four pendants, or individuals only connected to only one other person. Nevertheless, there were actors, ID2, ID1, ID15, ID10, ID19, ID7, and ID13 who had a high number of both reciprocal and unidimensional ties within the network.
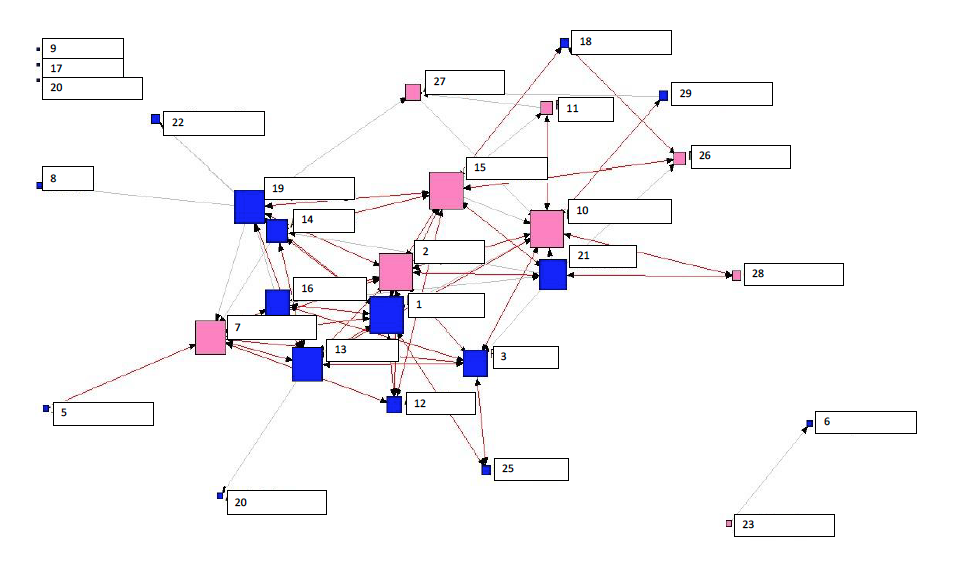
Figure 1. Map of existing relationships amongst class members.
Density of Existing Relationships in Network
Density of the network was analyzed, specifically, the number of ties observed in the network as a proportion of the total number of possible ties (Borgatti et al., 2018). A density value of .166 with an average degree of 4.66 was calculated. The result indicated across all possible connections between nodes, 16.6% of connections exist. Additionally, the mean number of connections per individual is 4.66 across the network.
Visualization of Advice Likelihood amongst Class Members
The visual representation of the advice seeking within the network is presented in Figure 2. The general characteristic of the network would indicate a centralized, core/periphery, pattern whereby there is a dense cluster of individuals located at the center of the network and the majority of the other individuals in the network distributed throughout the periphery of the network (Borgatti et al., 2018). Among the individuals clustered in the center of the network, ID4, ID9, ID22, and ID25 the nature of their centrality tends to be unidirectional, represented by grey lines, and not reciprocal, represented by red lines. Therefore, the centrality of these actors within the network is driven by their willingness to seek advice from many of their classmates. To the contrary actors ID2, ID10, and ID15 are more likely sources and recipients of advice within the network given the higher number of reciprocal ties. Actors ID1 and ID2 had the highest number of in-degree connections, or connections directed to them from others.
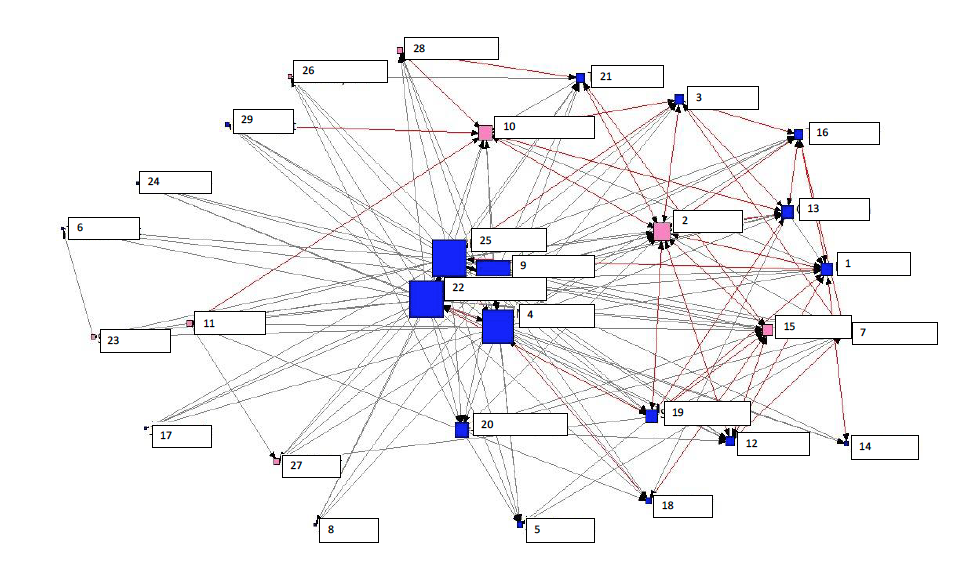
Figure 2. Map of advice seeking within the network
Density amongst Advice Likelihood Network
A density value of .238 with an average degree of 6.66 was calculated. The result indicated across all possible connections between nodes, 23.8% of connections exist. The mean number of connections per individual is 6.66 across the network.
Visualization of Support Likelihood amongst Class Members
The visual representation of the support seeking within the network is presented in Figure 3. The general characteristic of the network would indicate a centralized, or core/periphery, pattern whereby there is a dense cluster of individuals located at the center of the network and the majority of the other individuals in the network distributed throughout the periphery of the network (Borgatti et al., 2018). Individuals, ID4, ID9, ID22, ID25, and ID2 were clustered in the center of the network. Reciprocity of ties among actors was distributed among both central and peripheral actors.
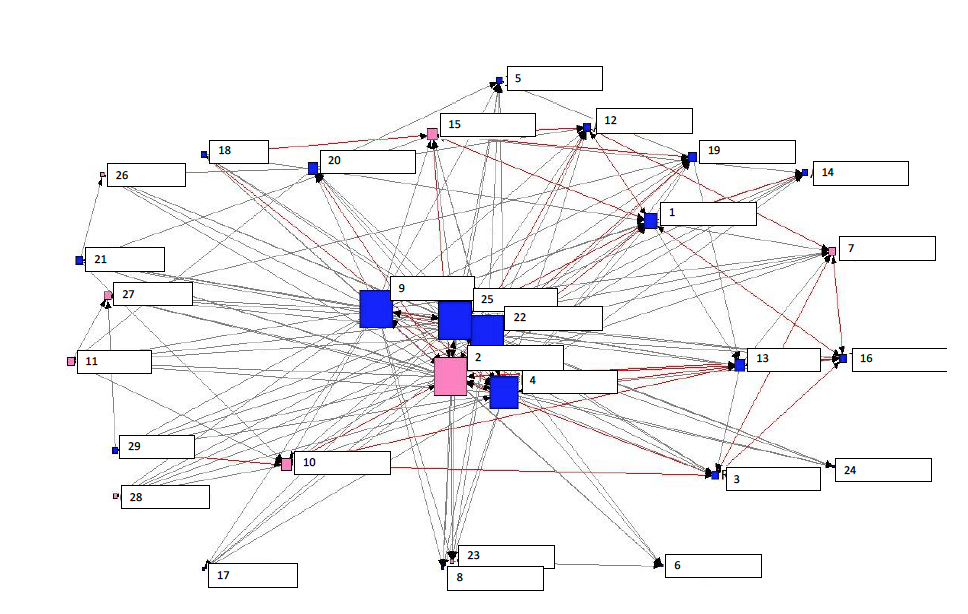
Figure 3. Map of support seeking within network.
Density amongst Support Likelihood Network
A density value of .249 with an average degree of 6.97 was calculated. The result indicated across all possible connections between nodes, 24.9% of connections exist. The mean number of connections per individual is 6.97 across the network.
Visualization of Industry Decision Influence amongst Class Members
The visual representation of the industry decision influence within the network is presented in Figure 4. The general characteristic of the network would indicate a decentralized pattern whereby there is there are limited central actors and connections between nodes in the network are limited (Borgatti et al., 2018). There were five individuals who were isolates. These individuals indicated none of the other classmates had a great deal of influence on the decisions made in their industry. Additionally, the remaining 24 classmates had the same response as it related to the five individuals influence on decisions made in their respective industries. Actor ID4 had the greatest number of connections among the network with the majority of ties being out-degree. Actor ID10 had the greatest number of in-degree connections.
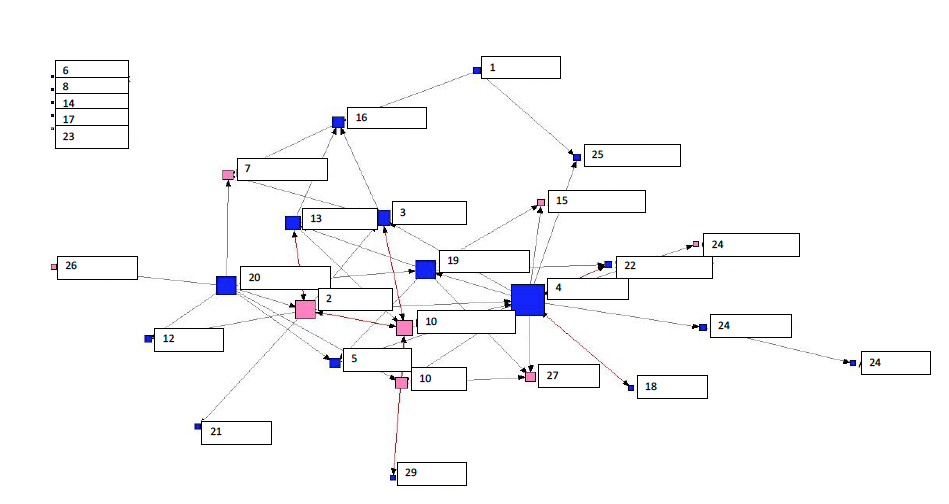
Figure 4. Map of industry decision influence within network.
Density amongst Industry Decision Influence Network
A density value of .060 with an average degree of 1.69 was calculated. The result indicated across all possible connections between nodes, 6.0% of connections exist. The mean number of connections per individual is 1.69 across the network.
Visualization of Industry Influence amongst Class Members
The visual representation of the industry influence within the network is presented in Figure 5. The general characteristic of the network would indicate a decentralized pattern with a clique structure, whereby there is there are limited central actors; however, there are subgroups identifiable based on key actors in bridge roles (Borgatti et al., 2018). There were five individuals who were isolates. These individuals indicated none of the other classmates had a great deal of influence on what happens in their industry. Additionally, the remaining 24 classmates had the same response as it related to the five individuals’ industry influence. Related to actors within the network, ID4, ID10, ID19, and ID13 were in bridge roles whereby they served to connect cliques within the network. Actor ID4 had the greatest number of connections among the network with the majority of ties being out-degree. Actor ID10 had the greatest number of in-degree connections.
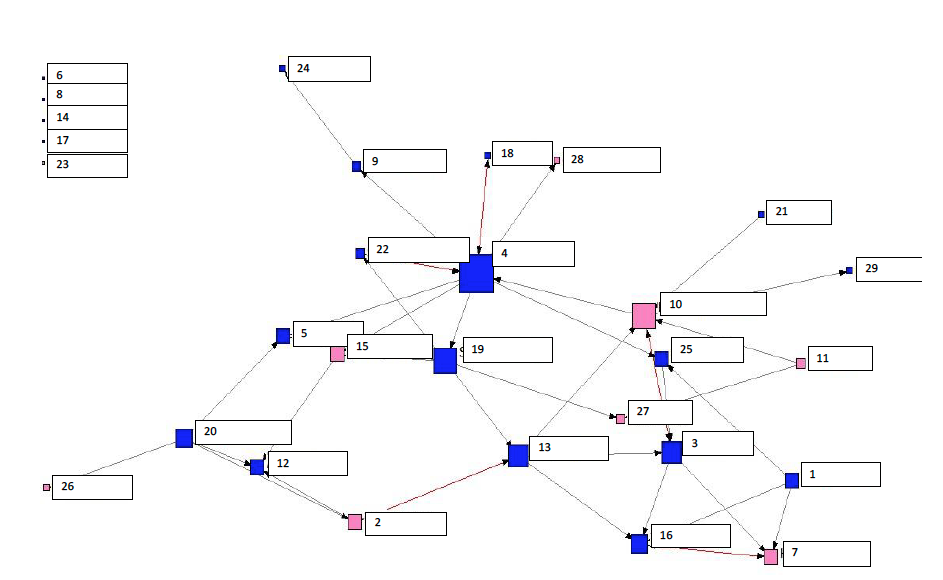
Figure 5. Map of industry influence within network.
Density amongst Industry Influence Network
A density value of .052 with an average degree of 1.45 was calculated. The result indicated across all possible connections between nodes, 5.2% of connections exist. The mean number of connections per individual is 1.45 across the network.
Conclusions, Implications, and Recommendations
Based on recommendations within the literature (e.g. Lamm, Carter, & Lamm, 2016), the current study was intended to provide a quantitative value as it relates to networks within ANR leadership development programs. Analyzing a single class of individuals at the start of a leadership development program provides an initial value to provide insights to the program director as they work with the class over the course of the program. Additionally, the results of the evaluation should provide a baseline, and evaluative model for other programs and social network analyses. As an emerging analytical technique social network analysis lacks an extensive literature base, particularly as it relates to ANR audiences and educational settings. Consequently, there are few established thresholds to inform what constitutes network considerations such as cohesion and density (Borgatti et al., 2018).
The analyses conducted were based on recommendations within the literature, specifically: identifying existing relationships among class members, identifying advice seeking within the network, identifying support seeking within the network, identifying individual influence on decisions within respective class member industries, and identifying individual influence on what happens within respective class member industries (Bono & Anderson, 2005).
The results of the analysis indicate for the analyzed class there is a mixture of existing relationships among participants. Specifically, there are unidimensional ties, reciprocal ties, central actors, periphery actors, pendants, and isolates. This result implies the current class has individuals who have known each other previously, as well as individuals who have not met anyone. Additionally, although there were several pre-existing relationships within the class, the network was not completely saturated, therefore there is an opportunity for the class to gain contacts and exposure within the agricultural and natural resource industry through program participation. A recommendation would be for the program leadership to purposively look for opportunities to integrate any isolates or pendants into the larger group.
Analysis of advice seeking within the class indicated there was a were a cluster of four individuals who were at the core of the network. Upon further analysis the directionality of ties within the advice network were noteworthy, especially in regard to non-reciprocated connections. Specifically, within social network analysis network centrality is calculated based on both in-degree (the number of people who would take advice from the individual) and out-degree (the number of people the individual would take advice from) connections. For example, if an individual had an in-degree of three and an out-degree of 25 their network centrality would be based on 28 total connections. If a second individual had an in-degree of 15 and out-degree of two, their network centrality would be based on 17 total connections. Therefore, the first individual would appear as more central to the network than the second; however, the second individual would be more valuable to the network based on the much larger number of people who would seek advice from them (Borgatti et al., 2018).
The results of the advice seeking analysis imply the program director should not consider ID25, ID9, ID22, and ID4 as class leaders based on their network centrality based on a high ratio of out-degree to in-degree connections. Instead these individuals are likely the most open to other ideas and insights, and humbler in their leadership and learning styles (Lamm, Carter, Stedman, & Lamm, 2014). However, ID1 and ID2 in the network had the highest number of in-degree connections, therefore these actors may be considered as opinion leaders within the group. A further implication from these findings is the program leadership may be able to use ID1 and ID2 as opinion leaders and disseminators of information within the network (Lazarsfeld, Berelson, & Gaudet, 1948).
Consistent with advice seeking within the network, support seeking had a similar structure. A group of five individuals were clustered in the center of the network with the remaining class distributed at the periphery of the network. The same actors, ID25, ID9, ID22, and ID4 were central in both advice seeking and support seeking networks. An additional actor, ID2 was also central in the supporting seeking network. A noteworthy different is the reciprocal nature of ID2 connections, specifically, this individual was not only willing to seek support from class members, but was also seen as a source of support for class members. This result is not unexpected given the position and number of connections ID2 was observed to have within the existing relationships analysis. An implication from this finding would be ID2 has the potential to take on a caretaking type role within the informal dynamics of the group. Seen as a source of support the individual may be well-positioned to liaise between class members, as well as between the class as a whole and program leadership.
Analyzing industry decision influence resulted in a less dense and less cohesive network. The results are expected given the diversity of ANR industries leadership development programs generally recruit from (Lamm, Lamm, & Carter, 2014). However, the results may also be valuable for the program leadership as specific experiences and educational interventions are planned. For example, if a goal for the program is to expose participants to a wide variety of ANR industries it may be more important to focus on the industries represented by isolates in the network. Specifically, ID6, ID8, ID14, ID17, and ID23 are not connected to the network indicating their industries are unique and not influenced by other actors in the class. Therefore, providing exposure to these industries may be beneficial for the participants. To the contrary if a goal for the program is the focus on a limited number of industries with the highest concentration of existing exposure it may be more appropriate to focus on the industries represented by more central actors in the network. Actor ID4 had the highest number of total connections, and ID10 had the highest number of in-degree connections. The industries represented by these individuals may be more appropriate if a more focused, tactical, and in-depth approach is preferred.
Shifting focus from industry decision influence to influence on what happens within industries a similar, but unique network pattern emerged. Unlike previous network visualizations, general influence had a clique formation indicated sub-groups within the class. This structure is informative as it should indicate to the program leadership there are likely specific industries represented within the class and there are actors who serve as bridges between the industries. Actors who serve in bridge roles are unique as they connect two, otherwise isolated cliques. Based on this information a recommendation for the program leadership would be to encourage actors ID4, ID10, ID19, and ID13 to actively contribute to peer learning conversations and share their unique insights (McKeachie & Svinicki, 2013). Active group conversation facilitation may stimulate conversations and perspectives that might not otherwise emerge.
Although there are contributions to both the literature base from a methodological and foundational result perspective, as well as practical implications for the evaluated ANR leadership development program there are limitations that should be addressed. First, interpretations of the results should be done within the context in which the data were collected. The data are only applicable to the program analyzed, trends, and generalizations should not be inferred beyond the class evaluated. Secondly, without existing thresholds to compare to, results and effect sizes should not be inferred. For example, a pre-existing observed network density of 16.6% cannot be interpreted as either dense or not dense. It should only be considered as a quantitative representation at a point in time.
Based on the results of the study and the noted limitations there are recommendations for future research. First, a recommendation would be for additional studies to replicate the analyses within similar environments, particularly ANR leadership development programs. As more results are available in the literature more pragmatic interpretation of results will be made possible. An additional recommendation is for the use of social network analysis to be conducted more widely throughout the agricultural education discipline. As an analytical technique social network analysis can serve to illuminate the otherwise obscured nature of relationships among learners in both formal and non-formal environments (Borgatti et al., 2018). An additional recommendation would be to analyze the diffusion of information from leadership development program participants into their networks or influence. Additional analysis of this nature would help quantify and measure the extent the value of information sharing and impacts associated with leadership development programs. As additional empirical data are collected related to social networks and information sharing, a recommendation would be to extend beyond binary measures of information sharing and to capture types and fidelity of activities and interactions. The more robust the data, the more actionable and informative the results can be for program directors. From a practical perspective a recommendation would be to collect social network data at both the beginning and end of ANR leadership development programs. Analysis of the difference in network composition and density following a program may serve as a valuable, quantitative, measure of impact and program efficacy. Such analysis will help to extend the results of this study and further inform “evaluation methods, models, and practices [that] are effective in determining the impacts of educational programs in agriculture and natural resources” (Roberts et al., 2016, p.43).
References
Bandura, A. (1977). Social learning theory. Englewood Cliffs, N.J.: Prentice-Hall.
Bass, B. M. (2008). The bass handbook of leadership. New York, NY: Free Press.
Bono, J. E., & Anderson, M. H. (2005) Advice and influence networks of transformational leaders. Journal of Applied Psychology, 90, 1306-1314.
Borgatti, S. P., Everett, M. G., & Johnson, J. C. (2018). Analyzing social networks. Thousand Oaks, CA: SAGE.
Borgatti, S. P., & Halgin, D. S. (2011). On network theory. Organization science, 22(5), 1168-1181.
Borgatti, S. P., Mehra, A., Brass, D. J., & Labianca, G. (2009). Network analysis in the social sciences. Science (New York, N.Y.), 323, 892-895. doi:10.1126/science.1165821
Brass, D. J., & Burkhardt, M. E. (1993). Potential power and power use: An investigation of structure and behavior. Academy of Management Journal, 36, 441-470.
Burt, R. S. (2009). Structural holes: The social structure of competition. Cambridge, MA: Harvard University Press.
Chrobot-Mason, D., Gerbasi, A., and Cullen-Lester, K. L. (2016), Predicting leadership relationships: the importance of collective identity. The Leadership Quarterly, 27, 298–311.
Coleman, J. S. (1988). Social capital in the creation of human capital. American Journal of Sociology, 94, 95-120. https://doi.org/10.1086/228943
Erickson, B.H., (2004). The distribution of gendered social capital in Canada. In: H. Flap, and B. Volker (Eds.), Creation and Returns of Social Capital (pp. 27–50). Routledge, London.
Hsung, R. M., Lin, N., & Breiger, R. L. (Eds.). (2010). Contexts of social capital: social networks in markets, communities and families (Vol. 43). Routledge. [Kindle version]. Retrieved from Amazon.com
Ibarra, H. (1993). Network centrality, power and innovation involvement: Determinants of technical and administrative roles. Academy of Management Journal, 36, 471-501.
Johnson, J. C., Boster, J. S., & Palinkas, L. A. (2003). Social roles and the evolution of networks in extreme and isolated environments. Journal of Mathematical Sociology, 27(2-3), 89-121. doi:10.1080/00222500305890
Kaufman, E. K., Rateau, R. J., Carter, H., & Strickland, R. (2012). What’s context got to do with it? An exploration of leadership development programs for the agricultural community. Journal of Leadership Education, 11(1), 121-139.
Kellerman, B. (2012). The end of leadership. New York, NY: HarperCollins.
Kelsey, K. D., & Wall, L. J. (2003). Do agricultural leadership programs produce community leaders? A case study of the impact of an agricultural leadership program on participants’ community involvement. Journal of agricultural education, 44(4), 35-46, doi:10.5032/jae.2003.04035
Lamm, K. W., Carter, H. S., & Lamm, A. J. (2016). Evaluating extension based leadership development programs in the southern united states. Journal of Agricultural Education, 57(1), 121-136. doi: 10.5032/jae.2016.01121
Lamm, K. W., Carter, H. S., Stedman, N. L., & Lamm, A. J. (2014). Teaching transformational leadership to undergraduate agricultural leadership students: Using the personality trait of agreeableness to improve understanding. Journal of Agricultural Education, 55(4), 24-37.
Lamm, A. J., & Lamm, K. W. (2017). Mapping the money: a social network analysis of funding relationships amongst higher education biology opinion leaders. Natural Sciences Education, 46(1), 1-10, doi:10.4195/nse2017.03.0006
Lamm, K. W., Lamm, A. J., & Carter, H. S. (2014). Opinion leadership development: Context and audience characteristics count. Journal of Agricultural Education, 55(2), 91-105.
Lazarsfeld, P., Berelson, B., & Gaudet, H. (1948). The people’s choice (2nd ed.). New York: Columbia University Press.
Lin, N. (2008). A network theory of social capital. In D. Castiglione, J. W. van Deth, & G. Wolleb (Eds.), The handbook of social capital (pp. 50-69). New York, NY: Oxford University Press.
Lin, N., Fu, Y., & Hsung, R. (2001). The position generator: Measurement techniques for investigations of social capital. In N. Lin, K. Cook, & R. Burt (Eds), Social capital, theory and research: 57–81. New York: Aldine de Gruyter.
McKeachie, W., & Svinicki, M. (2013). McKeachie’s teaching tips. Cengage Learning.
Mollenhorst, G., Völker, B., & Flap, H. (2008). Social contexts and personal relationships: The effect of meeting opportunities on similarity for relationships of different strength. Social Networks, 30(1), 60-68.
Northouse, P. G. (2013). Leadership: Theory and practice (6th ed.). Thousand Oaks: Sage Publications.
Roberts, T. G., Harder, A., & Brashears, M. T. (Eds). (2016). American Association for Agricultural Education national research agenda: 2016-2020. Gainesville, FL: Department of Agricultural Education and Communication.
Rogers, E. M. (2003). Diffusion of innovations (5th ed.). New York, NY: Free Press.
Ryan, R. M., & Deci, E. L. (2000). The “what” and “why” of goal pursuits: Human needs and the self-determination of behavior. Psychological Inquiry, 11(4), 227-268. DOI: 10.1207/S15327965PLI1104_01
Salk, J. E., & Brannen, M. Y. (2000). National culture, networks, and individual influence in a multinational management team. Academy of Management Journal, 43, 191-202.
Scott, C. P., Jiang, H., Wildman, J. L., & Griffith, R. (2017). The impact of implicit collective leadership theories on the emergence and effectiveness of leadership networks in teams. Human Resource Management Review, 28(4), 464-481. doi:10.1016/j.hrmr.2017.03.005
Woolcock, M., & Narayan, D. (2000). Social capital: Implications for development theory, research, and policy. The World Bank Research Observer, 15(2), 225-249. doi: 10.1093/wbro/15.2.225