Category

Vol. 71

Growing Wellbeing through Community Gardens in Georgia

Christina Garner, University of Georgia, christina.garner25@uga.edu

Kathleen D. Kelsey, University of Florida, kathleen.kelsey@ufl.edu

PDF Available

Abstract

Community gardens have been part of the American landscape for over 100 years. Recently, community gardens have been used to address food deserts and the obesity epidemic in the United States by increasing household access to fresh produce, physical activity, and social engagement. We report evaluation results from a community garden project located in a food desert in a Southeastern state. This particular county also had the highest rate of obesity in the state. Garden leaders described the impact of their gardening experiences on their well-being, access to fresh produce, and motivation to participate in the project. Well-being was enhanced through increased self-care and physical activity, reduced stress, a sense of contributing to others, and community cohesion. Garden leaders were motivated by opportunities to fulfill a request to participate, to teach others, to achieve self-fulfillment, to access fresh produce, and to try new recipes through Extension cooking classes. We recommend that local leaders adopt community gardens as a positive intervention to build cohesion and increase well-being among participants. Future research should focus on documenting the impact of community gardens on obesity and diabetes outcomes.

Introduction and Problem Statement

Community gardens have been part of the American landscape for well over 100 years. Their popularity has ebbed and flowed according to changing socioeconomic conditions such as war and economic stress. More recently, community gardens have been used to address food deserts and the obesity epidemic in the United States by increasing household access to fresh produce and engaging participants in more physical activity and social engagement (Draper & Freedman, 2010).

The United States Department of Agriculture (USDA) defined community gardens as “a plot of land, usually in urban areas that are rented by individuals or groups for private gardens or for the benefit of the people caring for the garden” (USDA, 2019, para 1). Community gardens are a reemerging trend in urban and rural landscapes because they enhance participants’ well-being through increased access to fresh produce, increased physical activity, and intergenerational and improved cross-cultural social engagement. Community gardens also contribute to social activism, urban beautification, green spaces, and agricultural and nutritional literacy. Well-placed community gardens help alleviate food deserts, as the food produced may be a conveniently available source of fresh produce for participants (Armstrong, 2000; Draper & Freedman, 2010; Loria, 2013; Ober Allen et al., 2008; Rupel, 2014; Twiss et al., 2003; Voluntad et al., 2004).

The evaluation study reported here was conducted in a small county in a Southeastern state with a population of 6,352. The county was classified as a food desert where 35% of the population lived in poverty and had the highest obesity rate in the state in 2019 (U.S. Census Bureau, 2019; USDA ERS, 2019a). To address these challenges land-grant university Extension agents received a grant from the Centers for Disease Control and Prevention in 2016 to: (a) increase access to healthier food options, (b) increase physical activity, and (c) improve communication of health-related activities among residences. After research and community assessments, Extension agents and community leaders determined raised-bed community gardens were an effective method for achieving the project goals.

This study addresses priority area six of the National Research Agenda for the American Association for Agricultural Education 2016 – 2020 (Roberts et al., 2016) by addressing research concerning vibrant, resilient communities with a particular focus on how agricultural programs impact communities and “appropriate models for engaging volunteers in the delivery of educational programs in agricultural and natural resources” (p. 51). In this article, we describe participants’ experiences and outcomes from participating in a community garden project.

Literature Review

History of and Justification for Community Gardens

The widespread use of community gardens in the U.S. emerged as relief for food shortages during World War II and were known as Victory Gardens (National WWII Museum, 2017). Approximately 40% of the fresh produce consumed in the U.S. was grown in one of the estimated two million Victory Gardens. Community gardens have been documented to benefit the well-being of individuals and communities by assisting vulnerable populations such as youth, the elderly, the homeless, and food insecure families by providing access to fresh produce, increased social interactions, increased physical activity, and agricultural and nutrition education (Twiss et al., 2003). In some communities, gardens have led to decreases in violence and improvements in social well-being through strengthened social cohesion (Bussell et al., 2017; Ober Allen et al., 2008).

Modern U.S. agricultural practices lead the world in efficiency and production, yet food insecurity affected 37.2 million Americans in 2018 (USDA ERS, 2019b). Food secure households were defined as having “access, at all times, to enough food for an active, healthy life for all household members” (USDA ERS, 2019b, para 2). Food insecure households are often located in food deserts or areas where access to fresh produce and meats are hampered by a lack of stores that sell these items or a lack of transportation to stores (USDA ERS, 2019a). Food insecure households also have higher than average rates of obesity as high calorie, low nutrient foods tend to be less expensive and more available than fresh produce and animal proteins (Bleasdale et al., 2011).

Health Benefits of Community Gardens

The World Health Organization (WHO, 1946, p. 1) defined health as a “state of complete physical, mental and social well-being and not merely the absence of disease or infirmity.” The Physical Activity Guidelines for Americans, published by the U.S. Department of Health and Human Services (2008) provided recommendations including “at least 150 minutes of moderate-intensity physical activity and muscle-strengthening exercises on two or more days each week.” Physical activity is defined as movement of the body that uses energy (USDA, 2015). Walking, gardening, climbing stairs, playing games, riding a bicycle, and dancing are all examples of physical activity.

Physical activity and exercise have frequently been reported as benefits of community gardens (Pate et al., 1995, Twiss et al., 2003, Wakefield et al., 2007). To describe the health benefits of a community garden, researchers include the physical, mental, nutritional, and social benefits received by participants. Community gardens offer the location and opportunity for increased physical activity and exercise. Wakefield et al. (2007, p. 100) reported that “the opportunity for physical activity that gardening presented was seen as beneficial to health, especially for the elderly.” Additionally, in a California Healthy Cities study (Twiss et al., 2003, p. 1,437), garden participants reported their physical activity increased 6% by increasing activity sessions from 4.9 to 5.2 times per week.

Mental health benefits have also been reported among community garden participants. The therapeutic landscapes allow participants to enjoy and connect with nature. “Horticultural therapy is a process through which plants, gardening activities, and the innate closeness we all feel toward nature are used as vehicles in professionally conducted programs of therapy and rehabilitation” (Davis, 1998, p. 3). Through community gardens participants often experience support, thus, increasing both psychological well-being and social well-being (Ober Allen, 2008). Positive well-being was not one of the intended goals for the gardens studied by Egli et al. (2016); however, the outcomes included an increase in well-being as a result of participating in community gardens.

Community gardens also increase access to fresh produce and contribute to community cohesion by bringing together intergenerational and cross-cultural community members for social interaction and labor sharing to produce food (Wakefield et al., 2007). Participants of a community garden project reported that their experience was “more than just planting seeds. It was about planting ideas, growing skills, and nurturing leadership and self-esteem in participants” (Voluntad et al., 2004, p. 1). Voluntad et al. (2004) also reported that the garden project was used to bridge the gap between Extension staff, seniors, and at-risk youth. Their reported approach gathered pertinent data regarding positive aspects of installing a community garden and shed light on the comradery that was built as an indirect result. To demonstrate the impact, one community garden participant in the Voluntad et al. (2004, p. 4) study said, “I would like to thank you for giving us the opportunity to be part of the community. Not only did I learn a lot about plants, I also learned how to give something back to the community.”

In summary, community gardens offer physical and mental health benefits by providing opportunities to eat fresh fruits and vegetables, engage in physical activity and skill building, create green space, beautify vacant lots, revitalize communities in industrial areas, decrease violence, and improve social well-being through strengthening social connections (CDC, 2010). Gardens also increased community cohesion and social networks among participants.

Purpose of the Study

The purpose of the study was to evaluate a community garden project in terms of participants’ well-being, access to fresh produce, community cohesion, and participants’ motivation to lead a garden site.

Methods

Evaluation research design was used to collect and analyze the data (Creswell & Poth, 2018), specially focusing on participant observation (DeWalt & DeWalt, 2011; Mack et al., 2005). All of the garden leaders (n = 11) were invited to participate in the study. Six leaders (55%) agreed to participate by sitting for an in-depth, face-to-face interview, providing food production data, and allowing for participant observation by the lead author. Participants’ names and research sites were changed to protect their privacy.

To increase trustworthiness, we chose a worthy topic to study, followed rigorous evaluation protocols, and were sincere in our efforts to collect and analyze the data. Our study is credible as the findings resonated with the participants through peer-debriefing sessions and provided a significant contribution to the garden leaders to better understand the impact of their efforts towards building community cohesion. We followed situational and procedural ethics as key markers of quality in qualitative research prescribed by Tracy (2010).

Interviews

The primary data source for this study was in-depth, face-to-face interviews. We developed an original semi-structured interview protocol based on the study purpose and conducted interviews with participants. The participants were selected because they volunteered to lead a community garden site. There were six garden sites with at least one garden leader at each site. Of the eleven individuals invited to participate, six accepted the invitation. There were several attempts to contact each garden site leader to ensure that they all had an opportunity to provide input. No incentives were offered to encourage participation.

One-on-one interviews were conducted with Rita and James. Pair interviews were conducted with Lee and Jake and Mike and Sara. The participants were granted the ability to select the interview time that worked best with their schedule. Interviews were conducted in November, 2018 at the county Extension office nearest to their community garden site. The interviews lasted between forty-five and sixty minutes. To create a welcoming atmosphere, refreshments were provided. The interviews were audio-recorded with permission from the participants.

The interview protocol focused on participants’ experiences with the gardens and outcomes resulting from the project. During the interviews, I followed the interview protocol and engaged in probing questions to further elaborate on responses. The interview atmosphere was relaxed and allowed for natural dialogue as I had established a working relationship with each of the participants.

The interview protocol included introductory questions that asked participants to describe their involvement in the community garden, the leadership structure of the garden, and how they became involved in the project. Personal impact questions were then asked regarding benefits received, dietary changes, and changes in activity levels as a result of participating in the garden. Community impact questions were asked to ascertain how they perceived the garden had effected the community in terms of cohesion. The interviews were concluded by asking participants to reflect upon their involvement in the gardens and what personal changes they had noted as a result of participating in the project.

Participant Observation

I used participant observation techniques to capture body language, comments, and physical behavior throughout the study. Observations took place in community settings that were relevant to the research questions. Participant observation can increase social trust and may inform the researcher about relevant cultural and economic contexts in the community in which the participants live. Building familiarity within the context of the research site allowed me to build a connection with participants and gain a deeper understanding of the behaviors and activities the participants describe during interviews (Mack et al., 2005).

As a participant observer, I conducted trainings with community members to teach them how to construct the garden beds and grow vegetables. The participants had training on data collection, harvest preparation, and food preservation methods. As the interviews approached, I prepared the participants by explaining the process of data collection and the purpose of the study, including informed consent. The interviews allowed for in depth conversations to provide rich information towards the effects of the community gardens while the observation data enabled me to examine how the project was implemented.

Researcher Reflexivity

My role in the community was as an Extension garden assistant through the AmeriCorps Volunteer in Service to America (VISTA) program. I assisted Extension agents and volunteers by piloting the garden project, conducting irrigation trials, and making plant selections for the gardens. I also created a demonstration garden allowing volunteers to observe the implementation of a garden and assisted the distribution team with sharing the produce with the community at harvest time. I worked alongside garden leaders, building trust and learning about their motives for volunteering, the vegetables they preferred to grow, and what changes they suggested for the garden project. I traveled to all of the garden sites, worked on various aspects of the gardens, and took detailed field notes related to the research questions.

My insider stance as a participant observer in the research process aided learning about the participants’ experiences from an emic perspective (Creswell & Poth, 2018), built trust with the garden leaders, and allowed me to observe and note how the program was implemented and concluded throughout the research cycle. My involvement increased the trustworthiness and reliability of the findings as my observations were used to triangulate the interview data and verify cultural norms within the research site (DeWalt & DeWalt, 2011).

Data Analysis

The participant observation notes were typed and coded according to a code book. The data was analyzed through latent content analysis method; determining the presence of certain words, themes, or concepts within the data (Babbie, 1992). Confirmability and trustworthiness was enhanced by taking detailed notes as well as comparing notes with other team members.

The interviews were guided by a semi-structured protocol, recorded, and transcribed verbatim. The transcripts were sent back to participants for member checking (Creswell & Poth, 2018). ATLIS.ti®, version 9.0 (2021), a computer-assisted qualitative data analysis software program, was used to open and free code the interviews for significant statements, which were then clustered into themes. The themes were synthesized to address the study purpose. Participants’ quotes were added to the findings to increase truth-value and add richness to the findings (Saldaña, 2015). Pseudonyms were used to protect participants’ privacy.

Data on the volume and type of food produced was collected by participants using a standardized form developed by the Extension program development coordinators. Descriptive statistics were used to report the size of the garden space and the amount and type of produce generated from each bed.

Research Sites

Extension agents, community leaders, and I constructed 30 raised-bed gardens in six different locations within the county. Community leaders were defined as those who were on the forefront of maintaining, harvesting, and recruiting volunteers for each of the garden sites. The raised-beds were approximately 8’ x 8’ for a total of 384 square feet of garden space per community. The total garden space constructed was 2,121 square feet (Table 1). Interested groups were required to submit an application to obtain garden materials. The six garden sites are described below.

County High School garden was led by the agricultural teacher and farmed by high school students enrolled in the agricultural education program. The produce was distributed to students and community members during the first year of production. Once established, the produce was more widely distributed within the community.

Charter Academy garden was led by the agricultural teacher and farmed by students enrolled in the agricultural education program. The teacher distributed produce to the school cafeteria. Extension agents and the school administration worked with the food service director to determine crops most beneficial to be cooked and served to students through the cafeteria.

Recreation Center garden was led by the director of the Boys and Girls Club and was farmed by adult volunteers. Extension agents assisted with a planting calendar, water recommendations, and insect control. The site served as a venue for after-school activities, including an outdoor classroom that was within walking distance to neighborhoods, allowing for community access to the garden and food distribution.

County Extension Office garden was led by the Extension agent and farmed by community members. This site was used as a demonstration garden for this project. The community was invited to learn about raised-bed construction techniques, irrigation systems, equipment, and planting suggestions.

County Commissioner’s Office garden was led by staff from the Commissioner’s office and farmed by volunteers. The location allowed community members to visit the garden, which generated dialogue regarding eating fresh produce and increasing physical activity. The produce was given to the community.

Boys and Girls Club garden was led by the club manager and farmed by youth in the program. The location was a successful outdoor learning space as well as a place for social gatherings.

Findings

All six participants reported having home gardens as children. Five participants worked full time, and one worked part time. Their average age was 40 years, with a range of 24 to 64 years. Two identified as women (Rita and Sara) and four as men (Jake, James, Lee, and Mike). Additional participant demographic characteristics can be found in Table 1.

Table 1
Participant Demographic Characteristics (N = 6)
NameAgeVocationWork full or part timeGarden SiteSq. ft. of garden space
Rita58Local gov. staffFullCommissioner’s office256
James64Nonprofit managerFullBoys and Girls Club384
Lee24Ext. AgentFullExt Office384
Jake40Ag. EducatorFullCounty High School384
Mike54Ag. EducatorFullCharter Academy384
Sara41Nonprofit staffPartRec. Center320

To address the goal of access to fresh produce, the volume of food produced is provided as a frame of reference. The gardens produced a total of 780 pounds of produce in 2018 (2.72 pounds per sq. ft.), including 188 pounds of broccoli, 78 pounds of cabbage, 201 pounds of collards, 28 pounds of eggplant, 30 pounds of mustard greens, 13 pounds of onions, 49 pounds of peppers, 40 pounds of rutabaga, 47 pounds of spinach, 44 pounds of Swiss chard, 12 pounds of tomatillos, and 50 pounds of turnips.

Themes

Five themes emerged from the data: (a) self-care, (b) increased physical activity, (c) reduced stress, (d) contribution to others, and (e) community collaboration.

Self-Care

All six participants reported that working in the gardens provided a therapeutic environment to reflect, enjoy, and focus on garden tasks, thereby creating a meditative experience. Rita said, “Mentally, it is my therapy to work in a garden” (1:8). Rita believed gardening improved her mental health by providing a relaxing environment to “get out and moving” (1:57).

Increased Activity

Rita and Mike reported that the gardens provided an opportunity to increase physical activity. Physical activity took the form of constructing the beds, preparing them for planting, weeding, cleaning out the beds after harvest, and watering. Jake said, “It’s really good exercise. Even better when you are cleaning them out and then planting and harvesting. You definitely break a sweat” (1:32). All six participants picked weeds or harvested on a daily or weekly basis, increasing their overall activity level. James noted that the gardens were located within walking distance to neighborhoods, providing a social gathering spot for adults and youth, especially in the summer.

Reduced Stress

Rita, Jake, Lee, and Mike reported that the gardens were in an easily accessible location outside of busy urban environments and helped to reduce daily stress. Sara said that the gardens provided “A little break from my desk” (1:66). Additionally, Sara, Rita, and Lee explained that the distraction of “pulling a few weeds or picking some stuff if they are ready” (1:67) allowed them to be more productive throughout the day.

Contribution to Others

Rita, Jake, Lee, and Sara reported that by being involved in the garden, they were able to provide food and support to others. Participants described delivering vegetables to the elderly, homeless, and low-income families. Sharing food grown in the community garden was particularly important in the teaching garden at the Extension office and the garden at the Boys and Girls Club. Youth maintained these gardens and donated food to those in need. James said, “It’s been a big plus for our organization” (1:44). All of the participants agreed that the gardens added community beautification by transforming previously unused lots into productive areas. The appearance of the gardens was a source of pride for the leaders.

Community Collaboration

Mike, Lee, Jake, Sara, and Rita reported that the gardens created an environment for collaboration among community members. The gardens were maintained by different groups of people who would not have interacted otherwise. Lee said, “Different gardens pull people from different areas in the county” (1:24), leading to networking among diverse community organizations. Sara said, “The different areas working together like the schools; the principals ask about the gardens, the city council members will be out there working…it’s just lots of different people, so I think it has strengthened those organizational ties” (1:70). Participants established friendships as “people stopped by the garden and started talking, learning, and asking questions” (Mike, 1:60). Jake said, “It’s the best thing our county has had in a long time” (1:92) as the garden increased social interaction among community members and provided fresh produce to vulnerable populations.

Motivation to Work in the Gardens

Participants were motivated to work in the garden because: (a) they were asked to participate, (b) for a teaching opportunity, (c) for self-fulfillment, (d) to access to fresh produce, and (e) for the opportunity to try new recipes. Each theme is discussed below.

Asked to Participate

Extension agents were the initial recruiters for garden leaders. They sought out gardeners through direct invitation. After being recruited by Extension agents, garden leaders recruited additional volunteers to participate in the project. Sara said, “I recruit people to come and work in the gardens, both kids and adults” (1:54). The participants had positive experiences with the garden, which led them to share their experiences with others.

Teaching Opportunity

The community gardens provided an environment for agricultural education at the school sites and a demonstration site at the Extension office. Mike was an agricultural education teacher. He reported that the gardens promoted positive peer interactions as well as strengthening youth-adult partnerships. He said that the gardens reinforced lessons on teamwork, food production, and food safety. Mike and Jake reported that the gardens were effective outdoor learning environments for experiential learning. Jake, an Extension agent, said, “I’ve done some education workshops out at the garden behind the Extension office” (1:28).

Self-Fulfillment

James and Rita’s motivation for participation was self-fulfillment and the enjoyment of seeing youth get excited about producing food. James said, “It is wonderful to see the kids go out there and actually pick produce and bring it in and cook it. Our kids like doing that” (1:58). Rita summed up her experience by saying, “I enjoy it! If you don’t enjoy it, you don’t do it!” (1:9).

Access to Fresh Produce

Access to fresh produce was a motivator for James, Jake, Lee and Rita. James said, “Fresh vegetables are the main benefit for me and the community” (1:41). “The benefits are worth the labor you have to put into the garden. It is rewarding in the end” (1:21) explained Lee. “I really enjoy it” (1:30) added Jake. All of the volunteers had first rights to the harvest; excess produce was then distributed to the community. All of the participants reported that the gardens provided more access to fresh produce and that they ate vegetables more frequently than before participating in the project. Rita continued to be involved because of the harvest. “I just let them get what they wanted, then I invite anybody and everybody to come get what they want” (1:3). Rita even went a step further to deliver food to those who were homebound.

Opportunity to Try New Recipes

As part of the project, Extension agents offered cooking classes to teach gardeners new recipes to use the produce from the garden. Sara said, “The Extension agents have done an outstanding job allowing the community to try different dishes other than just salads. It is very educational for me and several others” (1:65). Sara and Mike reported using many of the recipes designed for low-income households. Mike said, “I never imagined eating zucchini bread but we tried it” (1:64). The cooking classes also provided a social outlet for gardeners as a direct benefit of the garden project. Participants spent time “getting the vegetables and then researching a recipe that goes with them” (Mike, 1:63). Mike said, “The gardens have given community members access to fresh food and a place to exercise their body and minds and it needs to continue” (1:87).

Conclusions, Discussion, and Recommendations

The published literature described how community gardens fulfilled a variety of needs for diverse populations, especially youth, the elderly, and marginalized groups. Many authors have reported the benefits of community gardens including empowering gardeners to grow food for themselves and others, increasing participants’ social networks, and bridging community organizations (Armstrong, 2000; Bleasdale et al., 2011; Bussell et al., 2017; Draper & Freedman, 2010; Egli et al., 2016; Ober Allen et al., 2008; Rupel, 2014; Voluntad et al., 2004; Wakefield et al., 2007). Many of these same benefits were documented in this study.

Both physical and mental health benefits of community gardens have been well documented in previous research (Armstrong, 2000; Draper & Freedman, 2010; Ober Allen et al., 2008; Twiss et al., 2003; Wakefield et al., 2007). In this study, participants increased physical activity by building raised-beds, preparing them for planting, weeding, and harvesting. The six gardens provided a therapeutic environment for participants by providing a meditative experience and caring for others through food production.

Gardeners reported increasing their physical activity by walking to the gardens, weeding, harvesting, and maintaining the raised-beds. Being able to provide food to other community members was an important benefit as well. Our findings are consistent with Wakefield et al. (2007, p. 100) who reported, “community networks and social support were developed through the gardens.” Ober Allen et al. (2008) also found that community gardens enhanced nutrition while providing opportunities for interpersonal skill development and informal social control.

Motivation to participate in the garden project was based on being invited to participate by an Extension agent or other community leader, having an opportunity to teach others, self-fulfillment, access to fresh produce, and learning about new ways to cook vegetables. Voluntad et al. (2004, p. 1) stressed that “community gardens were about planting ideas, growing skills, nurturing leadership, and self-esteem” as added benefits. Giving food to others helped the recipients, as well as the giver, by increasing a sense of community cohesion.

The practical implications of the study demonstrate that community gardens can satisfy many social benefits by promoting well-being and social cohesion in a variety of settings. Because of the compelling and overwhelming evidence presented in the published literature of such benefits, it is recommended that community leaders adopt community gardens as a positive innovation to build community cohesion and increase well-being among participants.

Because the majority of published literature is qualitative with small populations, future research should focus on collecting empirical evidence on public health outcomes among gardeners as a result of community gardens. This evaluation study was undertaken by an AmeriCorps VISTA whose efforts contributed to the overall success of the project. Follow-up studies should examine how the gardens were maintained in the absence such support to determine if the gains documented here were sustained over time.

This study was limited by a small sample size (N = 6) and should not be generalized to other populations. Only garden leaders were interviewed. While they had extensive knowledge of the other gardeners and local neighborhood environments, they may have overstated benefits of gardening on behalf of non-study participants. Land access issues (who owns the land and gardeners’ rights to access) were not addressed in this study, which has served as a barrier to implementing successful community gardens in other studies. Extension agents must address land access as they plan for community gardens (Armstrong, 2000; Wakefield et al., 2007).

References

Armstrong, D. (2000). A survey of community gardens in upstate New York: Implications for health promotion and community development. Health & Place, 6(4), 319-327. https://doi.org/10.1016/s1353-8292(00)00013-7

ATLAS.ti (2021). A computer-assisted qualitative data analysis software (CAQDAS). Scientific Software Development GmbH. https://atlasti.com/

Babbie, E. R. (1992). The practice of social research. Wadsworth Publishing Company.

Bleasdale, T., Crouch, C., & Harlan, S. L. (2011). Community gardening in disadvantaged neighborhoods in Phoenix, Arizona: Aligning programs with perceptions. Journal of Agriculture, Food Systems, and Community Development, 1(3), 99-­114. https://doi.org/10.5304/jafscd.2011.013.007

Bussell, M. R., Bliesner, J., & Pezzoli, K. (2017). University of California pursues rooted research with a nonprofit, links the many benefits of community gardens: A study of eight San Diego county community gardens demonstrates their role in gardeners’ health and wellbeing and community development. California Agriculture, 71(3), 139­147. https://doi.org/10.3733/ca.2017a0029

Centers for Disease Control and Prevention. (2016). Nutrition. http://www.cdc.gov/nutrition/

Creswell, J. W., & Poth, C. N. (2018). Qualitative inquiry and research design: Choosing among five approaches (4th Ed). Sage Publications.

Davis, S. (1998). Development of the profession of horticultural therapy. In S. P. Simson & M. C. Straus (Eds.), Horticulture as therapy: Principles and practice (pp. 3­18). The Haworth Press, Inc.

DeWalt, K. M., & DeWalt, B. R. (2011). Participant observation: A guide for fieldworkers. (2nd ed.). AltaMire Press.

Draper, C., & Freedman, D. (2010). Review and analysis of the benefits, purposes, and motivations associated with community gardening in the United States. Journal of Community Practice, 18(4), 458­492. https://doi.org//10.1080/10705422.2010.519682

Egli, V., Oliver, M., & Tautolo, E. (2016). The development of a model of community garden benefits to wellbeing. Preventive Medicine Reports, 3, 348­352. https://doi.org/10.1016/j.pmedr.2016.04.005

Loria, K. (2013). Community garden information systems: Analyzing and strengthening community-based resource sharing networks. Journal of Extension, 51(2), 2FEA6. https://www.joe.org/joe/2013april/a6.php

Mack, N., Woodsong, C., MacQueen, K. M., Guest, G., & Namey, E. (2005). Qualitative research methods: A data collector’s field guide. Family Health International. https://www.intrec.info/Training%20material/Qualitative%20methods/Literature/1.%20fieldguide.pdf

National WWII Museum. (2017). UGA Extension: Introduction to Victory Gardens. http://extension.uga.edu/content/dam/extension/programs-and-services/school-gardens/documents/5-Historical-Victory-Garden-and-WWII.pdf

Ober Allen, J., Alaimo, K., Elam, D., & Perry, E. (2008). Growing vegetables and values: Benefits of neighborhood-based community gardens for youth development and nutrition. Journal of Hunger & Environmental Nutrition, 3(4), 418­439. https://doi.org/10.1080/19320240802529169

Pate R. R., Pratt, M., Blair, S. N., Haskell, W. L., Macera, C. A., Bouchard, C., Buchner, D., Ettinger, W., Heath, G. W., King, A. C., et al. (1995). Physical activity and public health. A recommendation from the Centers for Disease Control and Prevention and the American College of Sports Medicine. JAMA, 273(5), 402-407. https://doi.org/10.1001/jama.273.5.402

Roberts, T. G., Harder, A., & Brashears, M. T. (Eds). (2016). American Association for Agricultural Education national research agenda: 2016-2020. Gainesville, FL: Department of Agricultural Education and Communication.

Rupel, R. A. (2014). Growing community by growing food: A comparative study of two community gardens in north Texas. (Master’s Thesis). University of Texas at Arlington. UMI: 1572610

Saldaña, J. (2015). The coding manual for qualitative researchers. Sage Publications.

Tracy, S. J. (2010). Qualitative quality: Eight “Big-Tent” criteria for excellent qualitative research. Qualitative Inquiry, 16(10), 837-851. https://doi.org/10.1177/1077800410383121

Twiss, J., Dickinson, J., Duma, S., Kleinman, T., Paulsen, H., & Rilveria, L. (2003). Community gardens: Lessons learned from California healthy cities and communities. American Journal of Public Health, 93(9), 1435­1438. https://doi.org/10.2105/ajph.93.9.1435

United States Census Bureau. (2019). State and county quick facts. https://www.census.gov/

United States Department of Agriculture. (2019). National agricultural library. https://www.nal.usda.gov/afsic/community-gardening

United States Department of Agriculture; Economic Research Service. (2019a). Documentation. https://www.ers.usda.gov/data-products/food-access-research-atlas/documentation/

United States Department of Agriculture; Economic Research Service. (2019b). Key statistics & graphics. https://www.ers.usda.gov/topics/food-nutrition-assistance/food-security-in-the-us/key-statistics-graphics.aspx#foodsecure

U.S. Department of Health and Human Services (2008). 2008 Physical activity guidelines for Americans. https://health.gov/sites/default/files/2019-09/paguide.pdf

Voluntad, A., Dawson, P., & Corp, M. (2004). The Pendleton community garden project – more than just planting seeds. Journal of Extension, 42(6), 6IAW2. https://www.joe.org/joe/2004december/iw2.php

Wakefield, S., Yeudall, F., Taron, C., Reynolds, J., & Skinner, A. (2007). Growing urban health: Community gardening in South-East Toronto. Health Promotion International, 22(2), 92­101. https://doi.org//10.1093/heapro/dam001

World Health Organization. (1946) Constitution of the World Health Organization. Geneva: World Health Organization. https://www.who.int/governance/eb/who_constitution_en.pdf
Internal Branding of an AECL Department: Exploring Student Insights Regarding the Undergraduate Majors of Their Department

Katherine Bezner, Oklahoma State University, kbezner@okstate.edu

Audrey E. H. King, Oklahoma State University, audrey.king@okstate.edu

Lauren Lewis Cline, Oklahoma State University, lauren.l.cline@okstate.edu

Bree Elliott, Oklahoma State University, bree.elliott@okstate.edu

Kane Kinion, The Ohio State University, charles.k.kinion@okstate.edu

PDF Available

Abstract

First-year college students are entering higher education with less agricultural knowledge overall, leading to misperceptions about potential career paths associated with their chosen degree programs. Researchers in Oklahoma State University’s Agricultural Education, Communications and Leadership (AECL) Department’s pilot undergraduate research course desired to explore students’ perceptions of the department’s majors and internal brand. A quantitative, exploratory survey was completed by 207 students. Students felt most knowledgeable about their chosen major, were satisfied with their major choice, and anticipated obtaining a job upon graduation based on their major. When social pressures and career readiness perceptions of the majors were analyzed according to major program, most students showed a preference for their own major among the indicators. However, results varied on the students’ perceptions of other majors within the department. Agricultural communications was perceived the most positively by all AECL majors. Agricultural leadership was considered to be the most inclusive. Agricultural education was perceived to be the most important major program to the agricultural industry. It is recommended the AECL Department implement a multidisciplinary freshman orientation program, conduct a communications and branding assessment for recruitment and retention, and explore qualitatively the meaning of student perceptions of majors.

Introduction

Changing demographics among colleges of agriculture nationwide call for diverse degree options available to students (Foreman et al., 2018). First-year college students are also entering higher education with less agricultural knowledge overall (Colbath & Morrish, 2010), leading to misperceptions about potential career paths associated with their chosen degree programs. The attributes of academic programs are communicated by faculty and staff (Erdoğmuş & Ergun, 2016). Studies show factors such as potential financial earnings and social standing influence students’ perceptions of majors rather than the content and focus of the discipline itself (Fosnacht & Calderone, 2017). Simultaneously, the average job tenure across the U.S. is less than five years (Bureau of Labor Statistics, 2020). Perhaps the misconceptions regarding agriculture and its related majors, combined with the influential factors on major choice, have created a disconnect between major choice satisfaction and job tenure lengths for college of agriculture graduates (Scofield, 1994).

Agricultural education departments serve an essential role in preparing a skilled and proficient workforce (McKim et al., 2017). Moreover, it is important agricultural education departments, or programs encompass a variety of agricultural social sciences (Barrick, 1989). To achieve these goals, the Agricultural Education, Communications and Leadership (AECL) Department at Oklahoma State University (OSU) must understand the perceptions of its undergraduate students toward the departmental majors. This understanding could offer insights about the internal brand and culture of the department as a whole.

Researchers in the AECL Department’s pilot undergraduate research course desired to explore students’ perceptions of the department’s majors and internal brand. These students felt a disconnect between the three programs. The interdisciplinary research team developed this study to examine organizational silos within the department. The internal brand of the AECL Department was explored by surveying other undergraduate students.

Literature Review

As the interest in student retention has increased, research regarding student major satisfaction and undergraduate students’ perceptions has also increased. Student major satisfaction, which is influenced by internal branding, is a crucial component to a student’s academic success (Milsom & Coughlin, 2017). Moreover, major satisfaction is one of the largest factors impacting undergraduate student retention (Graunke &Woosley, 2005). Numerous studies have found students are influenced to choose majors with high job availability and high financial return (often referred to as career readiness indicators) after graduation (Del Rossi & Hersch, 2008; Baker et al., 2013). Moreover, recruitment materials for academic majors that demonstrate high job stability are most appealing to prospective students (Baker et al., 2011).

Other fields have studied the challenges that face departments when several majors are housed in one department. For example, bioinformatics majors face considerable challenges when integrating their major program into life sciences departments. Institutional support issues have been reported as a plausible cause for this department divide (Bianchi et al., 2019).

Institutional support issues are described as a lack of internal faculty support for a given major program (Bianchi et al., 2019). If a disconnect arises within a group, an organizational silo can form, impairing a department’s overall functionality (Evans, 2012). Evans (2012) described the reality of organizational silos by stating:

Silos segregate one type of grain from another and the segregated parts within an organization. In a business suffering from silo syndrome, each department or function interacts primarily within that silo rather than with other groups across the organization. (p. 176)

External branding efforts can bring awareness to available major programs; however, a student’s autonomy and connection to an academic department can be more meaningful (Joseph et al., 2012). Research indicates a student’s major choice can be impacted by the academic environment’s friendliness and atmosphere (Stair et al., 2016). Additionally, faculty can either perpetuate or address misconceptions related to college majors and can even influence a student’s major choice (Alam et al., 2019; Hertel & Dings, 2014). Research concerning student perceptions is commonly reported; however, there is a lack of research focused on undergraduate students’ perceptions of other major programs within an academic department. Staff and faculty opinions may contribute to students’ perceptions of not only their major but other programs as well (Hertel & Dings, 2014). Within academic departments, these interpersonal relationships between students and faculty can be challenging to cultivate. This can be influenced by departmental siloing, or the act of not crossing disciplines when conducting research, classwork, or other forms of learning (Guth, 2017). Therefore, by exploring an academic department’s brand value, one could better identify student perceptions and instill a proactive approach to prevent organizational siloing and promote learning (Friedman & Kass-Shraibman, 2017).

Theoretical Framework

Branding is not only a theory, but a practice that attempts to distinguish a product, corporation, or organization from others (Franzen & Moriarty, 2009). A brand is not a logo or tagline. A brand is created through a system of exchanges between brand managers and consumers, known as the receiver of branding messages. In this study, the brand manager is operationalized as the department as a whole, and students would be considered to be the brand consumers. It is impossible to understand a brand as independent from the environment in which it exists (Franzen & Moriarty, 2009). Moreover, a brand exists for an organization regardless of the intentional creation of the organization. Though abstract, a strong brand is invaluable in today’s marketplace (Swaminathan et al., 2020).

A critical aspect of branding efforts is creating a strong internal brand (Punjaisri & Wilson, 2011; Sartain & Schumann, 2006). An internal brand is displayed through the way the internal stakeholders display the brand to external audiences. Internal brands are particularly important for service-based organizations that depend on interactions between people to thrive (Schmidt & Baugmgarth, 2018). Internal branding can be promoted through relationships and peer-to-peer interactions. Studies have shown that teaching staff and attitude towards the university are major factors in student success and satisfaction within their major (Erdoğmuş & Ergun, 2016).

The framework for this study integrated internal branding and student perceptions. It was adapted from Punjaisri and Wilson’s 2011 work that described internal branding communication, including brand identification, brand commitment, and brand loyalty. The level at which these three components operate is known as an organization’s brand performance (Punjaisri & Wilson, 2011). When consumers and stakeholders identify with the brand, they consider themselves part of the brand itself (Punjaisri & Wilson, 2011). Brand commitment is the psychological connection between a brand or service and the stakeholder (Punjaisri & Wilson, 2011). Brand loyalty is the continued service and investment in a certain product or organization (Punjaisri & Wilson, 2011).

Recently, higher education branding has become a more researched phenomena (Chapleo, 2011; Dholakia, 2017). Universities, like corporate entities, work to distinguish themselves from the competition. However, universities are more complex than corporations, and therefore, so is their Branding (Mazzarol & Soutar, 2002). A strong university brand helps students navigate the decision of picking the university that is right for them by displaying the differences between schools and displaying the unique attributes of a university (Chen & Chen, 2014). Researchers agree that students’ educational experience is of the utmost importance in an overall university brand (Ng & Forbes, 2009; Pinar et al., 2014). Many factors, including departmental structure, faculty, staff, and peers, can be affected by a student’s educational experience and university brand.

The general atmosphere of the university also affects brand loyalty (Erdoğmuş & Ergun, 2016). A study has shown students value a sense of community not only within their department but also in their university as a whole (Erdoğmuş & Ergun, 2016). The same study also showed that fellow students’ opinions did not impact their educational choices. However, it is important for current and incoming students to have a positive relationship with program alumni, as their opinions and experiences are influential when students make educational decisions (Erdoğmuş & Ergun, 2016).

When studying students’ perceptions of brand equity (i.e., the value of a brand), researchers found the most important factors are the perceived quality of faculty, university reputation, brand loyalty, academic offerings, prestige, career readiness, and emotional environment. These factors are intertwined and ultimately build university brand awareness (Alam et al., 2019; Pinar et al., 2014). Similar to the emotional environment finding of Pinar et al. (2014), Eldegwy et al. (2018) found students who were satisfied with the social aspects of the university were more likely to recognize, recommend, and pay for the university brand.

Perceived quality of education, the institution’s social image, and job market success were important factors for university selection among students in the U.S. (Mourad et al., 2020). Studies have shown that faculty bring their brand to their classrooms. However, internal branding is related to the orientation of faculty behavior, which ultimately results in the student’s experience (Sujchaphon et al., 2015). Thus, for universities to deliver on their brand promise, it is important for faculty to properly communicate that brand (Sujchaphon et al., 2015).

University branding is a priority for undergraduate recruitment. The end goal for university first-year student success should be a long-term student retention rate (Cox & Naylor, 2018). A student’s feeling of self-efficacy influences retention. A sense of belonging can be heightened with involvement in an orientation program (Huddleston, 2000). Orientations are commonly used to communicate the culture and brand of an organization. Therefore, multidisciplinary classrooms with small and large group activities can serve as an innovative model to encourage peer-to-peer discussions and diversity of education (Stebleton et al., 2010). A collaborative, multidisciplinary approach to recruitment can serve as a vehicle for brand identification and brand loyalty.

Departmental Background

The OSU agricultural education program (EDUC) was established in the early 1920s (Oklahoma State University, personal communication, 2014). The department expanded to add an agricultural communications program (COMM) was added shortly after. As interest in the department continued to grow, the agricultural leadership program (LEAD) was approved in 2005 (Oklahoma State University, personal communication, 2005).

OSU has an undergraduate student retention rate of 83.2% (Oklahoma State University, 2014). The department has incorporated multiple strategies to retain students: one-on-one academic advising with faculty, developing major career paths, and academic support. These types of strategies increase the strength of the department’s internal brand. A strong internal brand can help to retain and attract students (Devasagayam et al. 2010). The strength of an internal brand is demonstrated through student or employee behaviors and their relation to organizational values (Simi & Sudhahar, 2019). A strong internal brand can result in increased student involvement in department clubs, professional organizations, and extracurricular activities. Organizations that are collaborative and demonstrate a unified internal brand are more appealing (Alshathry et al., 2017).

For the purpose of this study, the university brand is described as how external stakeholders view the organization, which includes students, parents, and mentors. Internal branding consists of the internal stakeholders, faculty, and staff, who have an inside viewpoint of the brand. We are going to frame this study to explore internal departmental branding, which we have operationalized to mean undergraduate students in the AECL Department at OSU and their perceptions of the department brand.

Research Purpose and Objectives

The purpose of this study was to describe the undergraduate AECL Department students’ perceptions of the AECL Department undergraduate majors at OSU. Three research questions guided this study:

  1. What perceptions do AECL Department students have about their majors?
  2. What perceptions do AECL Department students have about other majors in the department?

Methods

This study was conducted as a quantitative, exploratory survey using a 10-item researcher-developed questionnaire. The study was conducted at OSU among a convenience sample of undergraduate students in the AECL Department. Of the 389 enrolled undergraduate students in the department at the time, 208 completed the questionnaire, but one incomplete questionnaire was removed from the study. The final response rate was 53.2% (N = 207). AECL undergraduate students identified their major as agricultural education (EDUC; n = 66, 31.9%), agricultural communications (COMM; n = 98, 47.4%) and agricultural leadership (LEAD; n = 35, 16.9%). Eight students identified as one of several double-major options in the department; it is noted that these students were included in analysis of demographic data to describe participants to determine a representative sample, but not included in further analysis based on the research questions and low response rates per double-major option.

Demographic data were collected from the study’s participants (N = 207). Participants were classified academically as freshmen (n = 7, 3.4%), sophomores (n = 43, 20.8%), juniors (n = 74, 35.7%), and seniors (n = 82, 39.6%). Participants included 161 (77.8%) self-identified females and 46 (22.2%) self-identified males. Of this population, about 62% (n = 129) entered OSU as first-semester freshman, about 37% (n= 77) were transfer students, and less than one percent (n = 1) entered as an exchange student. More than three-quarters (n = 163, 78.7%) reported their hometown as a rural, agriculturally based community. Thirty-eight participants (18.4%) reported their hometown as urban/suburban. The distribution of participants across the undergraduate majors in the AECL Department was deemed to be representative of the overall population.

The questionnaire consisted of 10 items based on the literature review related to student major choice, career readiness indicators, and internal branding. The first item analyzed for this study explored the influence of social pressures (e.g., other people’s opinions, family pressure, prestige, and career readiness indicators) to AECL Department students’ choice of major. The remaining nine questions gathered demographic data.

To establish reliability, the questionnaire was piloted among a 15-person AECL Department graduate research methods course. The instrument demonstrated acceptable test- retest reliability with Phi correlation coefficients ranging between .51 and .90. Minor edits were made to items with poor reliability and an advisory group of three AECL Department faculty representing the three undergraduate majors to ensure the face and content validity of the final questionnaire. The finalized questionnaire was distributed during a one-week period of the fall semester among 20 departmental courses. Data were analyzed using SPSS© Version 23.

Descriptive statistics, including frequencies, percentages, means, and standard deviations were calculated to answer the research questions.

Results

Research Question 1: What perceptions do AECL Department students have about their majors?

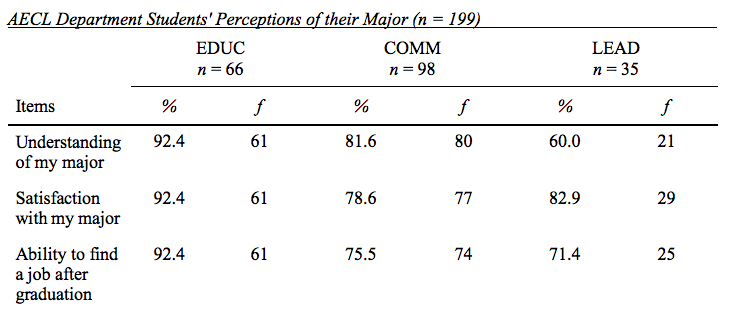
Analysis of the items related to the perceptions undergraduate AECL Department students had about their major program demonstrated students were most knowledgeable about their chosen major. As shown in Table 1, most EDUC and COMM students believed they understood their major, while fewer LEAD students felt the same. More than 70% of students in all three majors appeared to be satisfied with their major.

Table 1

Research Question 2: What perceptions do AECL Department students have about other majors in the department?

To address the second research question, students were given a set of career readiness indicators and asked to choose the major they believed provided the best opportunity for each indicator. The six indicators and student responses aggregated by major and total responses are provided in Figure 1.

Figure 1

When looking at the perceptions of EDUC students (n = 66) across the six indicators of career readiness, EDUC students preferred their major among three out of six indicators. EDUC students considered the EDUC major to be the most inclusive (n = 31, 47%) and provided the most job opportunities (n = 42, 63.6%). Of the remaining three indicators, EDUC students believed the COMM major had more high-quality careers (n = 35, 53%), the highest potential income earning opportunity (n = 38, 57.6%), and was the most progressive and forward thinking (n = 23, 34.8%).

COMM students (n = 98) preferred their major among five of the six indicators. COMM students believed the COMM major to be the most inclusive (n = 56, 57.1%), provided more job opportunities (n = 66, 67.3%;), a higher-quality career (n = 87, 88.8%;), and had the highest potential income-earning opportunity (n = 70, 71.4%). COMM students believed the EDUC major was the most important to the agricultural industry (n = 65, 66.3%).

LEAD students (n = 35) preferred their major among three of the six indicators. LEAD students believed the LEAD major provided more job opportunities (n = 18, 51.4%), was the most inclusive (n = 28, 80%), and was the most progressive and forward-thinking (n= 24, 68.6%). Of the remaining three indicators, LEAD students perceived the COMM major as providing more high-quality careers (n =18, 51.4%) and the major with the highest potential income-earning opportunity (n = 15, 42.9%). LEAD students believed the EDUC major was the most important to the agricultural industry (n = 23, 65.7%).

When looking at the overall data, a consensus was shown by students from the three majors among three of the career readiness indicators. When data were aggregated, students believed the EDUC major was the most important to the agricultural industry (n = 147, 73.8%). The LEAD major was believed by more than one-third of the students to be the most inclusive program (n = 72, 36.2%). The COMM major was believed to provide more job opportunities (n = 98, 49.2%), more high-quality careers (n = 140, 70.4%), the highest potential income earning opportunity (n = 123, 61.8%), and to be the most progressive and forward thinking (n = 94, 47.2%).

Conclusions and Implications

Participants in the study were more likely to report their background as rural and agriculturally based than urban, which is representative of college of agriculture demographics at other institutions (Foreman, et al., 2018). More than three-quarters of students’ hometowns were a rural, ag-based community. Therefore, it could be concluded the prevalence of rural students might impact the internal branding of the AECL Department, as there may be a significant difference in major choice and perceptions between students with rural/ag-based backgrounds and urban/suburban students. Participants in this study were also primarily female, similar to the student population’s overall demographics within the College of Agriculture and Life Sciences at Iowa State University (Foreman, et al., 2018). The ratio of enrollment for male and female participants in our study was also consistent with the changing demographics of other colleges of agriculture in the United States (Foreman, et al., 2018). Perhaps the department’s recruitment efforts are over-investing in rural, ag based communities. The AECL Department’s internal brand influences undergraduate students and their perceptions of majors within the department. To increase collaboration, a multidisciplinary orientation course can enhance peer-to-peer discussions and diversity of education (Stebleton et al., 2010).

Research Question 1: What perceptions do AECL Department students have about their majors?

Findings indicated most AECL Department students felt they were knowledgeable, satisfied, and able to obtain a job after graduation with their major program. These positive preferences correlate to strong major satisfaction and internal branding buy-in. It seems natural for students to be most knowledgeable about their own majors. Strong major satisfaction is related to higher GPA levels, and it should be noted that students interested in multiple major programs do not necessarily improve their academic standing (Milsom & Coughlin, 2017). A student’s sense of belonging can be most influenced by interaction with faculty and staff members (Alam et al., 2019). Similarly, faculty members can contribute to student perceptions of other majors in an academic department (Hertel & Dings, 2014). Our college requires faculty academic advising, and most departmental faculty have a majority teaching appointment.

Participants in our study have the most exposure to their major program’s peers and faculty, which may have also impacted their perceptions of the department’s internal brand.

Research Question 2: What perceptions do AECL Department students have about other majors in the department?

Overall, COMM was perceived the most positively by all AECL Department majors. COMM was consistently identified as a major with career opportunities and benefits for graduates. EDUC was portrayed as the most important major to the agricultural industry. LEAD was considered to be the most inclusive. It is worth noting the COMM major was the most represented in our sample for this study. When perceptions of the majors were analyzed by their major program, most students showed a preference for their own major among the indicators. However, results varied on the students’ perceptions of other majors within the department. As a result, COMM student responses may have skewed the distribution of aggregated data for most items. This insight draws attention to the fact that LEAD was considered to be the most inclusive major despite students in each major perceiving their own major to be the most inclusive. Perhaps there were more defectors, or less consensus, within the majors for that particular item. Our findings could translate to a possible organizational silo within the AECL Department based on students’ tendency to prefer their own major among the items. Students enrolled in majors without multidisciplinary crossover may be in a less functional learning environment operating as an organizational silo (Friedman & Kass-Shraibman, 2017).

Recommendations

The findings demonstrate theoretical implications for student major selection. Based on the congruency between the findings in this study and the literature review, these are the following recommendations for the AECL Department: (a) implementation of a multidisciplinary freshman orientation program; (b) a recruitment assessment for retention; and (c) a qualitative study examining the meaning of student perceptions of majors.

A multidisciplinary freshman orientation course should be implemented to increase collaboration within the AECL Department and reduce a perceived organizational silo. This course would be a collaboration between faculty and graduate students in the department. At OSU, other programs have implemented orientation courses including animal science, agricultural economics, and a basic orientation course for all freshmen enrolled in the college of agriculture. Other disciplines have successfully implemented multidisciplinary courses, which increased the confidence level of major choice among their undergraduate students (Copp et al., 2012).

A multifaceted communications approach focused on the department’s internal brand is needed for the success of both student recruitment and student retention rates. The internal branding of a department is most effective when all programs work cohesively (Alshathry, 2017). The buy-in for internal branding among potential and current students positively correlates to personal meetings (Devasagayam, 2010). High-achieving students are not influenced by campus visits alone; therefore, we suggest that faculty continue to hold personal meetings face-to-face with prospective students and academic advising meetings with current students. Additionally, departmental branding and communications should be evaluated for cohesiveness and inclusive representation of each major program across recruitment materials and publications.

To improve organizational siloing within the department, the lack of understanding between the three major programs needs to be addressed. Perhaps a disconnect in the internal branding of the department has created misconceptions between students. A more collaborative departmental environment could increase student buy-in and academic success (Schreiner, 2009). As student buy-in rises, the department will have less student turnover and major changes.

Perhaps a qualitative study could explain the meanings of AECL Department student perceptions toward other majors in the department. An additional exploratory study would be beneficial to interview students and gauge from their responses how they perceive the internal Branding of the AECL Department. These conclusions could be used to further strengthen the internal brand of the AECL Department and improve both faculty and student brand loyalty.

Future research should also be conducted on the number of AECL Department students who work in the agricultural industry after graduation. This study was focused more on the quantity of student responses, whereas future studies could look to see if different perceptions of majors exist based on a variety of student demographic variables.

Our research had several limitations, one being that career readiness and programmatic statements were based on our (the research team’s) perceptions of the department majors. The internal brand of a department may not be viewed the same by each of its constituents. Another limitation of this study was the inability to generalize and apply the results to other departments and institutions. It would be beneficial to replicate this study within the social sciences departments of other colleges of agriculture. The instrument needs to be validated among multiple settings with the target population for continued research use.

Although our research focused on students within the AECL Department at OSU, this study may serve as a guide to gain a better understanding of the agricultural education discipline as a whole. More research needs to be conducted on student major choice and satisfaction in the social science field of agriculture. Future studies should include students who change their major and leave the department. It is evident AECL Department students communicate and perceive majors, and levels of career readiness within those majors, differently; this can be a limitation for students if they have misconceptions about the career readiness and opportunities of a major.

References

Alam, M. I., Faruq, M. O., Alam, M. Z., & Gani, M. O. (2019). Branding initiatives in higher educational institutions: Current issues and research agenda. Marketing and Management of Innovations, 1, 34-45. https://doi.org/10.21272/mmi.2019.1-03

Alshathry, S., Clarke, M., & Goodman, S. (2017). The role of employer brand equity in employee attraction and retention: A unified framework. International Journal of Organizational Analysis, 25(3), 413-431.  https://doi.org/10.1108/IJOA-05-2016-1025

Baker, L., Settle, Q., Chiarelli, C., & Irani, T. (2013). Recruiting strategically: Increasing enrollment in academic programs of agriculture. Journal of Agricultural Education, 54(3), 54-66. https://doi.org/10.5032/jae.2013.03054

Baker, L. M., & Abrams, K. (2011). Communicating strategically with generation me: Aligning students’ career needs with communication about academic programs and available careers. NACTA Journals, 55(2), 32-39. https://www.nactateachers.org/attachments/article/1148/Baker_JUNE%202011%20NACTN%20Journal-8.pdf

Barrick, K. (1989). Agriculture education: Building upon our roots. Journal of Agricultural Education, 30(4), 24-29. https://doi.org/10.5032/jae.1989.04024

Bianchi, C., Williams, J. J., Drew, J. C., Galindo-Gonzalez, S., Robic, S., Dinsdale, E., Morgan, W. R., Triplett, E. W., Burnette, J. M., Donovan, S. S., Fowlks, E. R., Goodman, A. L., Grandgenett, N. F., Goller, C. C., Hauser, C., Jungck, J. R., Newman, J. D., Pearson, W. R., Ryder, E. F., Sierk, M., Smith, T. M., Tosado-Acevedo, R., Tapprich, W., Tobin, T. C., Toro-Martínez, A., Welch, L. R., Wilson, M. A., Ebenbach, D., McWilliams, M., Rosenwald, A. G., & Pauley, M. A. (2019). Barriers to integration of bioinformatics into undergraduate life sciences education: A national study of U.S. life sciences faculty uncover significant barriers to integrating bioinformatics into undergraduate instruction. Plos One, 14(11), 1-9. https://doi.org/10.1371/journal.pone.0224288

Bureau of Labor Statistics. (2020). Employee Tenure in 2020. U.S. Department of Labor. https://www.bls.gov/news.release/pdf/tenure.pdf

Chapleo, C. (2011). Exploring rationales for branding a university: Should we be seeking to measure branding in the U.K. universities? Journal of Brand Management, 18(6), 411-422. https://doi.org/10.1057/bm.2010.53

Chen, C.-F., & Chen, C.-T. (2014). The effect of higher education brand images on satisfaction and lifetime value from students’ viewpoints. Anthropologist, 17(1), 137-145. https://doi.org/10.1080/09720073.2014.11891423

Colbath, S. A., & Morrish, D. G. (2010). What do college freshman know about agriculture: An evaluation of agricultural literacy. NACTA Journal, 54(3), 14-17. https://www.nactateachers.org/attachments/article/414/Colbath_September_2010_NACTN_JOURNAL-5.pdf

Copp, N. H., Black, K., & Gould, S. (2012). Accelerated integrated science sequence: An interdisciplinary introductory course for science majors. Journal of Undergraduate Neuroscience Education, 11(1), A76-A81. https://www.ncbi.nlm.nih.gov/pmc/articles/PMC3592751/

Cox, S., & Naylor, R. (2018). Intra-university partnerships improve student success in a first- year success and retention outreach initiative. Student Success, 9(3), 51-64. https://doi.org/10.5204/ssj.v9i3.467

Del Rossi, A. F., & Hersch, J. (2008). Double your major, double your return? Economics of Education Review, 27(4), 375-386. https://doi.org/10.1016/j.econedurev.2007.03.001

Devasagayam, R. P., Buff, C. L., Aurand, T. W., & Judson, K. M. (2010). Building brand community membership within organizations: A viable internal branding alternative? Journal of Product & Brand Management, 19(3), 210-217. https://doi.org/10.1108/10610421011046184

Dholakia, R. R. (2017). Internal stakeholders’ claims on branding a state university. Services Marketing Quarterly, 38(4), 226-238. https://doi.org/10.1080/15332969.2017.1363580

Eldegwy, A., Elsharnouby, T. H., & Kortam, W. (2018). How sociable is your university brand? An empirical investigation of university social augmenters’ brand equity. International Journal of Educational Management, 32(5), 912-930. https://doi.org/10.1108/IJEM-12-2017-0346

Erdoğmuş, İ., & Ergun, S. (2016). Understanding university brand loyalty: The mediating role of attitudes towards the department and university. Procedia – Social and Behavioral Sciences, 229, 141-150. https://doi.org/10.1016/j.sbspro.2016.07.123

Evans, N. (2012). Destroying collaboration and knowledge sharing in the workplace: A reverse brainstorming approach. Knowledge Management Research & Practice, 10(2), 175-187. https://doi.org/10.1057/kmrp.2011.43

Foreman, B., Retallick, M., & Smalley, S. (2018). Changing demographics in college of agriculture and life sciences student. NACTA Journal, 62(2), 161-167. https://www.nactateachers.org/attachments/article/2730/12%20Beth%20Foreman.pdf

Fosnacht, K., & Calderone, S. M. (2017). Undergraduate financial stress, financial self-efficacy, and major choice: A multi-institutional study. Journal of Financial Therapy, 8(1), 107-123. https://doi.org/10.4148/1944-9771.1129

Franzen, G., & Moriarty, S.E. (2009). The Science and Art of Branding (1st ed.). Routledge. https://doi.org/10.4324/9781315699042

Friedman, H. H., & Kass-Shraibman, F. (2017). What it takes to be a superior college president: Transform your institution into a learning organization. The Learning Organization, 24(5), 286-297. https://doi.org/10.1108/tlo-12-2016-0098

Graunke, S., & Woosley, S. (2005). An exploration of the factors that affect the academic success of college sophomores. College Student Journal, 39(2), 367-376. https://go.gale.com/ps/anonymous?id=GALE%7CA133606107&sid=googleScholar&v=2.1&it=r&llinkacces=abs&issn=01463934&p=AONE&sw=w

Guth, D. J. (2017). Building a new structure. Community College Journal, 87(5), 28-33. https://eric.ed.gov/?q=guth+2017+building+a+new+structure&id=EJ1142040

Hertel, T. J., & Dings, A. (2014). The undergraduate Spanish major curriculum: Realities and faculty perceptions. Foreign Language Annals, 47(3), 546-568. https://doi.org/10.1111/flan.12099

Huddleston, T. J. (2000). Enrollment management. New Directions for Higher Education, 111(7), 65-73. https://doi.org/10.1002/he.11107

Joseph, M., Mullen, E. W., & Spake, D. (2012). University branding: Understanding students’ choice of an educational institution. Journal of Brand Management, 20(1), 1-12. https://doi.org/10.1057/bm.2012.13

Mazzarol, T., & Soutar, G. N. (2002). “Push‐pull” factors influencing international student destination choice. International Journal of Educational Management, 16(2), 82-90. https://doi.org/10.1108/09513540210418403

McKim, A. J., Greenhaw, L., Jagger, C., Redwine, T., & McCubbins, O. P. (2017). Emerging opportunities for interdisciplinary application of experiential learning among colleges and teachers of agriculture. NACTA Journal, 61(4), 310-316. https://www.nactateachers.org/attachments/article/2669/McKim_EmergingOpportunities.pdf

Milsom, A., & Coughlin, J. (2017). Examining person-environment fit and academic major satisfaction. Journal of College Counseling, 20(3), 250-262. https://doi.org/10.1002/jocc.12073

Mourad, M., Meshreki, H., & Sarofim, S. (2020). Brand equity in higher education: Comparative analysis. Studies in Higher Education, 45(1), 209-231. https://doi.org/10.1080/03075079.2019.1582012

Ng, I. C. L., & Forbes, J. (2009). Education as service: The understanding of university experience through the service logic. Journal of Marketing for Higher Education, 19(1), 38-64.  https://doi.org/10.1080/08841240902904703

Pinar, M., Trapp, P., Girard, T., & Boyt, T. E. (2014). University brand equity: An empirical investigation of its dimensions. International Journal of Educational Management, 28(6), 616-634. https://doi.org/10.1108/ijem-04-2013-0051

Punjaisri, K., & Wilson, A. (2011). Internal branding process: Key mechanisms, outcomes and moderating factors. European Journal of Marketing, 45(9/10), 1521-1537. https://doi.org/10.1108/03090561111151871

Sartain, L., & Schumann, M. (2006). Brand from the inside. Jossey-Bass.

Schmidt, H. J., & Baumgarth, C. (2018). Strengthening internal brand equity with brand ambassador programs: development and testing of a success factor model. Journal of Brand Management, 25(3), 250-265. https://doi.org/10.1057/s41262-018-0101-9

Schreiner, L. A. (2009). Linking student satisfaction and retention. Noel-Levitz.

Scofield, G. G. (1994). An Iowa study: Factors affecting agriculture students career choice.

NACTA Journal, 38(4), 28-30. https://www.nactateachers.org/attachments/article/754/Scofield_NACTA_Journal_Dec_1919-7.pdf

Simi, J., & Sudhahar, C. (2019). Dimensions of internal Branding: A conceptual study. Journal of Management, 6(1), 177-185. https://doi.org/10.34218/jom.6.1.2019.019

Stair, K., Danjean, S., Blackburn, J. J., & Bunch, J. C. (2016). A major decision: Identifying factors that influence agriculture students’ choice of academic major. Journal of Human Sciences and Extension, 4(2), 111-125. https://www.researchgate.net/publication/304494995_A_Major_Decision_Identifying_Factors_that_InfluencI_Agriculture_Students’_Choice_of_Academic_Major

Stebleton, M. J., Huesman, R. L. J., & Kuzhabekova, A. (2010). Do I belong here? Exploring immigrant college student responses on the SERU survey sense of belonging/satisfaction factor. Center for Studies in Higher Education Research & Occasional Paper Series, 13(10), 1-12. https://cshe.berkeley.edu/sites/default/files/publications/rops.stebleton_et_al.immigrantstudents.9.14.10.pdf

Sujchaphong, N., Nguyen, B., & Melewar, T. (2015). Internal branding in universities and the lessons learnt from the past: The significance of employee brand support and transformational leadership. Journal of Marketing for Higher Education, 25(2), 204-237. https://doi.org/10.1080/08841241.2015.1040104

Swaminathan, V., Sorescu, A., Steenkamp, J.-B. E. M., O’Guinn, T. C. G., & Schmitt, B. (2020). Branding in a hyperconnected world: Refocusing theories and rethinking boundaries. Journal of Marketing, 84(2), 24-46. https://doi.org/10.1177/0022242919899905

How Programmatic Changes Impact the Lesson Plan Quality of Student Teaching Interns: A Comparison of Two Formats

Jeffery Whisenhunt, Union County Career Center

Christopher J. Eck, Clemson University, eck@clemson.edu

J. Shane Robinson, Oklahoma State University, shane.robinson@okstate.edu

Ki L. Cole, Oklahoma State University, ki.cole@okstate.edu

Jim Key, Oklahoma State University, james.key@okstate.edu

Jon W. Ramsey, Oklahoma State University, jon.ramsey@okstate.edu

PDF Available

Abstract

Effective teaching is a multidimensional concept that encompasses a need for instructional planning to make a positive impact on students. The purpose of this study was to determine the extent to which the student teaching format for pre-service teachers at Oklahoma State University impacted their lesson plan quality. A quasi-experimental design using a non-equivalent control group was implemented to compare student teaching formats at Oklahoma State University. Personal characteristics between the counterfactual and the treatment groups were similar. When considering lesson plan quality, a statistically significant finding was detected in favor of a longer student teaching internship. Based on the findings of this study, it is recommended that agricultural education teacher preparation programs evaluate their student teaching format, as well as the progression and delivery of courses, to allow for the greatest potential for the development of human capital related to teaching.

Introduction

Effective teaching can be considered “an elusive concept to define when we consider the complex task of teaching and the multitude of contexts in which teachers work” (Stronge et al., 2011, p. 340). Further, it is a multidimensional construct (Farrell, 2015) that includes instructional delivery, student assessment, learning environments, and personal qualities of the teacher (Stronge et al., 2011). Effective teaching requires individuals who can relate to the demographic and cultural differences between the teacher and the students (Hollins & Guzman, 2005). Teachers who are considered effective have high expectations, contribute to positive student learning outcomes, use a variety of resources, celebrate diversity within a classroom, and collaborate with their students in the learning process (Goe et al., 2008). These attributes of effective teaching assume a certain level of lesson planning and execution.

Preparation through instructional planning forms the basis for effective teaching and student learning (Reiser & Dick, 1996). Sung (1982) found that students taught by teachers who used highly structured lesson plans had a higher level of academic achievement than those who were taught by teachers who used less structured lesson plans. Lesson planning is a proactive strategy used by teachers to anticipate how topics will be delivered in the learning environment (Bond & Peterson, 2004). Lesson plans allow the instructor additional control of classroom experiences and outcomes instead of merely reacting to what happens (Duke & Madsen, 1991). Thus, it is critical for teacher preparation programs to facilitate pre-service teachers’ development in an efficient means for instructional planning (Baylor & Kitsantas, 2005; Kitsantas & Baylor, 2001; Kress et al., 2008). 

One of the roles of higher education institutions that include agricultural education programs is to prepare students for teaching careers (Franklin & Molina, 2012; Myers & Dyer, 2004). Despite working toward the same goal of pre-service teacher preparation, each institution requires its own admission criteria, coursework, and student teaching experiences within their respective teacher education programs (Franklin & Molina, 2012; Graham & Garton, 2003; Myers & Dyer, 2004; Shinn, 1997; Swortzel, 1999). Such programs in agricultural education seek to assist teacher candidates in achieving licensure according to specific state and national teacher education accreditation standards (Myers & Dyer, 2004; Swortzel, 1999; Retallick & Miller, 2007, 2010). What is more, the student teaching internship has been incorporated into the accreditation standards (CAEP, 2019; CCSSO, 2013; Retallick & Miller, 2007, 2010).

Traditionally, agricultural education programs have focused on preparing pre-service teachers to teach in middle schools and high schools across the country (Myers & Dyer, 2004). Most teacher educators are tenure-track faculty who were former secondary agricultural education teachers (Myers & Dyer, 2004; Swortzel, 1998). Unfortunately, not every agricultural education program is actively producing certified agricultural education teachers (McLean & Camp, 2000; Myers & Dyer, 2004). Although the majority of agricultural education programs are housed in colleges of agriculture, around one-fifth are situated in colleges of education (Myers & Dyer, 2004; Swortzel, 1999). Despite degree requirements varying across programs (Franklin & Molina, 2012; Graham & Garton, 2003; Myers & Dyer, 2004; Shinn, 1997; Swortzel, 1999), courses of commonality include methods of teaching, program planning, and student teaching (McLean & Camp, 2000; Myers & Dyer, 2004; Retallick & Miller, 2007, 2010). 

The role of an agricultural teacher educator includes preparing pre-service teachers to transition into professional educators while also providing professional development to in-service teachers (Franklin & Molina, 2012; Myers & Dyer, 2004). In addition, recruitment, faculty development, and delivering college-wide, service-type courses are important responsibilities of teacher educators in agricultural education (Hillison, 1998; Myers & Dyer, 2004). Despite this expansion of responsibility, various school-based agricultural education (SBAE) teachers and state staff consider pre-service teacher preparation to be the greatest responsibility of university agricultural education programs (Myers & Dyer, 2004). After completing coursework in a teacher preparation program, pre-service teachers typically culminate their learning experience through the student teaching internship, which links the university experience to the secondary classroom (Franklin & Molina, 2012; Torres & Ulmer, 2007; Retallick & Miller, 2007, 2010).

The Student Teaching Internship

The student teaching internship is a highly influential component of preparing pre-service teachers (Franklin & Molina, 2012; Myers & Dyer, 2004; Retallick & Miller, 2007, 2010; Zuch, 2000). Pre-service teacher attitudes often change throughout the student teaching internship (Myers & Dyer, 2004) based on the mentorship, communication, expectations, and discipline management plans provided by their cooperating teachers (Harlin et al., 2002; Myers & Dyer, 2004; Young & Edwards, 2006). Further, cooperating teachers highly influence future instructional practices of pre-service teachers (Garton & Cano, 1996; Harlin et al., 2002; McKee, 1991; Myers & Dyer, 2004; Young & Edwards, 2006). The relationship between the cooperating teacher and the university supervisor also plays an important role in pre-service teachers’ development during the student teaching internship (Deeds et al., 1991; Franklin & Molina, 2012; Myers & Dyer, 2004). 

The student teaching internship provides pre-service teachers opportunities to demonstrate knowledge and skills regarding pedagogy in an actual classroom under the guidance of a cooperating teacher (Kelleher et al., 1995; Retallick & Miller, 2007, 2010; Torres & Ulmer, 2007). The Agricultural Education program at Oklahoma State University (OSU) highly values the student teaching experience and considers it “the most dynamic and vital phase of the total curriculum for preparing teachers of Agricultural Education” (Oklahoma State University, 2012b, p. 1). During the student teaching experience in Oklahoma, pre-service teachers are expected to acquire competence in fifteen areas. Some of these areas include teaching high school students, advising the FFA chapter, facilitating supervised agricultural experiences, preparing students for competitions, organizing community events, and counseling students (Oklahoma State University, 2012b).

Pre-service teachers work through four phases during their student teaching experience: Phase 1: orientation and observation – allows pre-service teachers to familiarize themselves with the classroom and discuss observations with their cooperating teacher; Phase 2: progressive teaching experience – allows pre-service teachers to begin routine procedures such as planning, preparing, grading, tutoring, and eventually teaching one or two courses under the close supervision of their cooperating teacher; Phase 3: extensive teaching experience – allows pre-service teachers to assume responsibility for the full course load while receiving regular feedback from their cooperating teacher; and Phase 4: culminating experience – allows pre-service teachers the opportunity to observe other teachers in the school (Oklahoma State University, 2012b). 

The valuable, real-life experience of the student teaching internship provides a safe space for pre-service teachers to implement pedagogical knowledge and skills under the guidance of a veteran mentor teacher (Roberts & Ball, 2009; Robinson et al., 2010; Swanson, 1971; Talbert et al., 2005; Torres & Ulmer, 2007). Although the importance of student teaching has been well documented, the delivery (i.e., duration of the internship) and its impact on student teachers is lacking. Over the past 40 years, student teaching internships have ranged from less than 10-week, part-time placements to full-time immersive experiences greater than ten weeks in duration (Wasburn-Moses, 2018). “Although student teaching has been and continues to be the most intensive field experience of traditional teacher preparation, little research has been conducted on the student teaching experience, or changes to that experience over time” (Wasburn-Moses, 2018, p. 703).

What is more, although pre-service teachers dedicate the majority of their time in their student teaching internship to planning, research has shown they do so at an inconsistent rate (Torres & Ulmer, 2007; Torres et al., 2008). Further, because the contents of a lesson plan can directly impact what is taught and learned in the classroom (Ball et al., 2007; Torres & Ulmer, 2007), it is imperative to determine how a pre-service teachers’ preparation program impacts student teachers’ lesson plan quality.

Theoretical Framework

This study was framed in the human capital theory, which includes the pertinent education, skills, and training (Becker, 1964; Little, 2003; Schultz, 1971; Smith, 2010; Smylie, 1996) provided through an agricultural education teacher preparation program. Pre-service SBAE teachers are preparing for their student teaching internship and, ultimately, a career; therefore, the teacher preparation coursework provides an opportunity to increase human capital and improve personal competence related to their future vocation (Heckman, 2000). This development of human capital is impacted by the individual’s previous experiences, most of which are acquired through informal training and experiences (Sweetland, 1996), leading to a variety of needs within a pre-service teaching cohort. The agricultural education teacher preparation program at OSU serves as a formal opportunity (Sweetland, 1996) for students interested in a career as an SBAE teacher to acquire the necessary skills for the teaching profession (Schultz, 1971). The culminating experience during the agricultural education teacher preparation program at OSU is the student teaching internship, which serves as an apprenticeship or on-the-job training, which Schultz (1961) identified as one of the five major categories of human capital development.

To further conceptualize the teacher preparation program and the human capital development of pre-service teachers within the program, Clark’s and Peterson’s (1986) model of teacher thought and action was used. Constraints and opportunities have a direct impact on the individual’s actions and thought processes (Clark & Peterson, 1986). Further, an individual’s thought process has a bi-directional relationship with his or her actions (Clark & Peterson, 1986). Ball et al. (2007) used Clark’s and Peterson’s (1986) model as a conceptual frame, where they connected the model with lesson planning. The conceptual model adapted from Ball et al. (2007) includes the reciprocal relationships between and among the constraints and opportunities for planning, the impact of those constraints on thinking about and planning for teaching, and the resulting plans (Figure 1). Additionally, the model (Figure 1) depicts the bidirectional relationship between “what teachers think and believe and what teachers do” (Ball et al., 2007, p. 57).

Figure 1
Conceptual model adapted from Ball et al. (2007) from the model of teacher thought and action of instructional planning (Clark & Peterson, 1986).

The model (Figure 1) served as a conceptual framework for this study, allowing the researchers to consider the constraints and opportunities presented within the student teaching format at OSU for pre-service SBAE teachers. The combination of constraints and opportunities provided through two different student teaching formats can be assessed by the quality of lesson plans developed by pre-service SBAE teachers in both formats. Further, the model can help demonstrate the preparedness of pre-service SBAE teachers at OSU based on their overall human capital development within the program’s two formats.

Purpose of the Study

The purpose of this study was to determine the extent to which making programmatic changes, such as the student teaching internship for pre-service teachers at OSU, impacted their lesson plan quality by comparing two distinct formats. Two research questions guided this study: (1) What is the level of lesson plan quality of pre-service SBAE teachers who student taught in the Fall 2011 and Spring 2012 semesters compared to those who student taught in the Fall 2019 and Spring 2020 semesters? (2) What impact did the student teaching format have on the lesson plan quality of pre-service SBAE teachers at OSU during the two timeframes?

Methods and Procedures

A quasi-experimental design using a non-equivalent control group (Privitera, 2017) was used to compare two distinct student teaching formats in agricultural education at OSU. Because students complete their student teaching internships at the end of their academic studies and cannot be randomly assigned to a particular cohort, the quasi-experimental design was appropriate for this study (Privitera, 2017). The non-equivalent control group consisted of those who student taught during Fall of 2011 and Spring of 2012. The treatment group consisted of those who student taught during Fall 2019 and Spring 2020.

Student Teaching Cohort – Fall 2011 and Spring 2012

The format used during the 2011 to 2012 school year served as the study’s non-equivalent control group and required pre-service teachers at OSU to participate in three courses during their student teaching semester. Pre-service teachers in the non-equivalent control group enrolled in 15-credit hours of coursework during their student teaching semester. The courses consisted of a three-credit hour teaching methods course, a three-credit hour laboratory supervision course, and a nine-credit hour course that included the student teaching internship. The semester began with two four-week block courses, which consisted of pedagogical training in the classroom and laboratory settings (Oklahoma State University, 2010a).

During the block experience, students learned pertinent teaching methods related to agricultural education in a laboratory setting. In addition, the block experience assisted in pre-service teachers’ ability to identify community resources and secure teaching resources through involvement in professional organizations (Oklahoma State University, 2010a). Students simultaneously acquired facets of the teaching and learning processes, which included course content related to teaching methods, basic teaching skills, proper classroom management techniques, and motivational techniques and ideas (Oklahoma State University, 2012a). The laboratories embedded in the four-week block experience provided opportunities for students to practice behavioral management techniques, develop a complete unit of instruction, design formative and summative assessments, and deliver lessons using multiple methods and media (Oklahoma State University, 2012a). On completion of the four-week block experience, students transitioned to their cooperating center communities to complete their 12-week student teaching internship.

Student Teaching Cohort – Fall 2019 and Spring 2020

The format used during the 2019 to 2020 school year served as the study’s treatment group and required pre-service teachers at OSU to participate in one one-week course during the student teaching semester. The Teaching Methods course, which was part of the four-week experience for the Fall 2011 and Spring 2012 cohort, was converted to a 16-week course for the Fall 2019 and Spring 2020 cohort and was designed to provide the learning experiences through the context of the InTASC Model Core Teaching Standards and Performance Indicators (Oklahoma State University, 2019). Specifically, learning experiences in the Teaching Methods course sought to prepare pre-service teachers with the instructional capability to positively impact student learning. The lens of the Praxis Performance Assessment for Teachers (PPAT) served as a framework for the course objectives (Oklahoma State University, 2019).

Pre-service teachers in the treatment group enrolled in 12-credit hours of coursework during their student teaching semester. Three of those credit hours included the Student Teaching course, which is a full-time, directed experience in agricultural education at OSU. It included applications of methods and skills in agricultural education as related to selecting, adapting, using, and evaluating curriculum materials to meet educational goals and facilitate learning for individual students. Experiences also involved identifying the roles, responsibilities, and interactions related to other school personnel, parents, and professional education groups.

The remaining nine credit hours were acquired in a Professional Development course, which focused on professional preparation and development for careers as agricultural education teachers. Professional correspondence, interviewing, networking, and other employability skills were taught in the course. Reflection and evaluation of instruction, project supervision, and advising of youth leadership development organizations also were emphasized. The course consisted of a one-week, on-campus seminar before students transitioned to their respective student teaching centers, a two-day midterm seminar, and a three-day capstone seminar. Table 1 provides a side-by-side comparison between the non-equivalent control (Fall 2011and Spring 2012) and treatment groups (Fall 2019 and Spring 2020).

Table 1   
Comparison of Student Teaching Formats at OSU

Note. aFall 2011 and Spring 2012 Student Teaching Cohort; bFall 2019 and Spring 2020 Student Teaching Cohort; cCourses are taken within the same 16-week semester during student teaching. dCourse is taken during the 16-week semester prior to the 16-week student teaching semester.  

Prior to entering the student teaching experience, pre-service teachers must pass the Oklahoma General Education Test (OGET), which is required for teacher certification (Oklahoma State University, 2018). The OGET measured various areas of knowledge such as reading, communication, mathematics, science, art, literature, social sciences, and writing (Oklahoma Commission for Teacher Preparation, 2007). The OGET consists of broad competencies which “reflect the general education knowledge and skills an entry-level educator need[ed] to teach effectively in Oklahoma public schools” (OCTP, 2007, p. 2-1). Mathematic competencies range from problem-solving using data interpretation and analysis to problem-solving using a combination of mathematical skills (OCTP, 2007). Science competencies include understanding and analyzing major scientific principles, concepts and theories as well as applying skills, principles, and procedures associated with scientific inquiry (OCTP, 2007). 

Oklahoma requires two additional test requirements for teacher certification (Certification Examinations for Oklahoma Educators (CEOE), 2020). Those include the Oklahoma subject area test (OSAT) for agricultural education and the Oklahoma professional teaching exam (OklahomaPTE). The professional teaching exam was the OPTE before changing to the Praxis Performance Assessment for Teachers (PPAT) in 2019. The change in professional education exams is another factor impacting the preparation of pre-service SBAE teachers at Oklahoma State University.

The agricultural education subject area test consists of one constructed response in addition to 80 selected-response questions covering six subareas including agricultural business, economics, and marketing; animal science; plant and soil science; agricultural mechanics; environmental science and natural resources; and foundations of agricultural education (CEOE, 2020). The OPTE is a written exam spanning three subareas (i.e., learners and learning, instructional practice, and the professional environment) with a total of 10 competencies (CEOE, 2020). The exam includes “75 selected response questions and 3 written performance assignments” (CEOE, 2020, p. 1). Scaled scores for the OPTE range from 100 to 300, with a passing score of 240 or greater (CEOE, 2020). The OPTE was replaced with the adoption of the PPAT in 2019. The PPAT was adopted to evaluate “test takers on their abilities to impact student learning as it relates to the InTASC Model Core Teaching Standards, demonstrating that they have the basic pedagogical content knowledge and application for the classroom to begin teaching as an entry-level teacher” (ETS, 2020, para. 2).

The personal characteristics of pre-service agricultural education teachers (N = 70) during the Fall 2011 and Spring 2012 (n = 30) and Fall 2019 and Spring 2020 (n = 40) semesters are outlined in Table 2. Specifically, the participants’ age, gender, and ethnicity are included.

Table 2 
Personal Characteristics of Two Cohorts of Pre-service SBAE Teachers at OSU during the 2011 to 2012 and 2019 to 2020 Academic Years

Lesson plan quality was evaluated using the Lesson Plan Evaluation Rubric, which is the same rubric used by the [Oklahoma State University Department of Agricultural Education] to evaluate students’ lesson plans throughout all the department’s agricultural education courses (Oklahoma State University, 2010b). Participants of the study were introduced and required throughout their agricultural education courses to use the same lesson plan format for which the grading rubric aligned (Oklahoma State University, 2012a). The lesson plan template and grading rubric were founded around Allen’s (1919) 4-step instructional model and Tyler’s (1949) four questions. This lesson plan format was based on a maximum of 20 points possible during the 2011 to 2012 school year. However, during the 2019 to 2020 school year, the rubric was updated to reflect the principles of the Praxis Performance Assessment for Teachers (PPAT) and was based on a maximum of 25 points, but still included the same primary principles as the one used with the Fall 2011 and Spring 2012 student teaching cohort. The PPAT was introduced as a new certification requirement during the 2019 to 2020 school year; therefore, the changes to the rubric were necessary to reflect the additional expectations required by the certifying agency.    

For the 2011 to 2012 school year, a panel of three experts who had in excess of 10 years of school-based agricultural education (SBAE) teaching experience and two years of post-secondary teaching experience was organized to evaluate the quality of those lesson plans.  The panel consisted of graduate students in agricultural education at OSU who were familiar with the departmental grading rubric, having used it to evaluate students in agricultural education courses and laboratories previously. In comparison, for the 2019 to 2020 school year, a panel of three experts who had in excess of 30 years of SBAE experience and 20 years of post-secondary experience was organized to evaluate the quality of those lesson plans. The panel consisted of a faculty member, instructor, and a graduate student of agricultural education at OSU.

For inter-rater reliability (Ary et al., 2010; Gay et al., 2009), the panelists evaluated 10 lesson plans individually and then together. Panelists scored, discussed, and ultimately settled on a normative scoring procedure for the lesson plans prior to receiving their own sets of lesson plans to score. Data analysis began with three randomly selected lesson plans from each participant in the two cohorts using www.randomizer.org. The lesson plans were divided randomly among the respective panel members. Microsoft Excel® was used to organize the data, followed by the Statistical Program for Social Sciences (SPSS), Version 23 for data analyses. 

Basic descriptive statistics (i.e., frequencies and percentages) were used to summarize the data for research questions one. Specifically, the lesson plan quality score was attributed based on the departmental lesson plan rubric, which aligned with the department lesson plan template. The 2011 to 2012 rubric allows for scores to range between zero and 20; whereas, the 2019 to 2020 rubric was evaluated on a scale ranging from zero to 25. The analysis of overall percentage scores was used to assess the overall quality of the lessons. A one-way ANOVA was used to assess the study’s dependent and independent variables (Field, 2009) for research question two, which consisted of the actual quality score assigned to the pre-service teachers’ lesson plans and the student teaching format (12-week or 15-week), respectively.

The researchers acknowledge the limitations of this study, as two chronologically disparate groups (2011 to 2012 and 2019 to 2020) were evaluated using different rubrics and experts to evaluate the lesson plans. The gap in years serves as a major limitation to the study, although the research team acknowledges this as existing data (2011 to 2012 non-equivalent group) was utilized to compare to the treatment group (2019 to 2020) for data collection and analysis. Additionally, changes in program delivery (i.e., teaching methods course, student teaching format, and changes in. instructors) limit the findings of this study. The research team addressed these limitations through a priori decisions in this post-hoc research design considering the multitude of limiting factors. Therefore, these limitations should be considered when interpreting the findings, conclusions, and recommendations. 

Findings

Research question one sought to describe the quality of pre-service SBAE teachers’ lesson plans during the student teaching internship, per the departmental lesson plan rubric. Lesson plan scores for pre-service teachers during the Fall of 2011 and Spring of 2012 resulted in three (3.3%) lesson plan quality scores ranging between 0 and 2.50, six (6.7%) between 2.51 and 5.00, 11(12.2%) between 5.01 and 7.5, five (5.6%) from 7.51 to 10.00, seven (7.8%) between 10.10 and 12.50, 18 (20.0%) from 12.51 to 15.00, 15 (16.7%) between 15.10 and 17.50, and 25 (27.8%) lessons had a quality score range of 17.51 to 20.00 (Table 3). Lesson plan scores for pre-service teachers during the Fall of 2019 and Spring of 2020 resulted in three (2.5%) lesson plan scores between 0 and 12, four (3.3%) from 13 to 15, 24 (20.0%) between 16 and 18, 39 (32.5%) from 19 to 21, and 50 (41.7%) between 22 and 25 (Table 3).

Due to the difference in lesson plan quality score scales (i.e., 0 to 20 for 2011 to 2012 and 0 to 25 for 2019 to 2020), percentage scores were used to compare the two cohorts of student teachers (Table 3). Table three identifies the breakdown in lesson plans by percentage scores, which relate to a specific letter grade (i.e., F = 0 to 59.99, D = 60.00 to 69.99, C = 70.00 to 79.99, B = 80.00 to 89.99, and A = 90.00 to 100.00). The greatest number of lesson plans reviewed in the 2011 to 2012 cohort received a failing quality score ranging between 0.00 to 59.99 (f = 27, 30%). In contrast, the greatest number of lesson plans reviewed in the 2019 to 2020 cohort received a “B” quality score ranging between 80.00 to 89.99 (f = 45, 37.5%).

Table 3 
Lesson Plan Quality Scores of Two Cohorts of Pre-service SBAE Teachers at OSU during the 2011 to 2012 and 2019 to 2020 Academic Years

The second research question aimed to determine the impact of the student teaching format on lesson plan quality. The overall quality of pre-service teachers’ lessons during the 2011 and 2012 school year equated to a mean percentage score of 66.1% (SD = 5.37), and the overall quality of pre-service teachers’ lessons during the 2019 to 2020 school year resulted in a mean percentage score of 82.2% (SD = 3.11). A one-way ANOVA was conducted using SPSS, with the lesson plan scores as the dependent variable and the student teaching format (12-week versus 15-week) as the independent variable (Table 4). The analysis resulted in a statistically significant difference between the two groups F (1, 208) = 20.95, p < .01.

Table 4

Comparative Analysis of Pre-Service Teachers’ Lesson Planning Performance by Group Means

Conclusions

Personal characteristics between the non-equivalent control (Fall 2011 and Spring 2012) and the treatment (Fall 2019 and Spring 2020) groups were similar. The majority of pre-service SBAE teachers in both groups were between 21 and 22 years of age, female, and predominately white. These characteristics support the current trends over the past 10 years in the agricultural education department at OSU. The personal characteristics also align with 2018 supply and demand of SBAE teachers (NAAE, 2019), which identified “the majority of new agricultural education majors [as] Caucasian (90%) and female (71%)” (p. 1).

When considering lesson plan quality, the mean percentage scores increased from 66.1% (SD = 5.37) for the Fall 2011 and Spring 2012 cohort to 82.2% (SD = 3.11) for the Fall 2019 and Spring 2020 cohort. The difference in lesson plan quality scores can be attributed, in part, to two major programmatic changes: 1) the duration of the student teaching experience, which was aligned with the recommendations of Myers and Dyer (2004) to increase the focus on teaching and learning in the agricultural education teacher preparation program, and 2) to the increased credit hours reserved for teaching lesson planning to pre-service teachers. In addition to these two major changes, other modifications also occurred in the teacher preparation program at OSU during the 8-year time span of this study. These included Oklahoma certification requirements, course delivery offerings at OSU, and the instructors who impacted the course offerings and data collection, all of which provide limitations to the study. However, the faculty of this teacher preparation program were willing to make the changes if they might lead to improvements in pre-service teachers’ ability regarding their lesson planning and perceptions about planning (Ball et al., 2007; Clark & Peterson, 1986), as depicted in Figure 1.  

The difference in mean percentage scores between the non-equivalent control and treatment groups were statistically significantly different F(1, 208) = 20.95, p < .01. This change in lesson plan quality scores supports the need for teacher preparation programs to facilitate pre-service teachers’ development in an efficient means for instructional planning (Baylor & Kitsantas, 2005; Kitsantas & Baylor, 2001; Kress et al., 2008). This need was met by altering the teaching methods course from a 4-week block experience to a 16-week semester-long course prior to student teaching. The change in content delivery between the student teaching formats resulted in positive outcomes within the treatment group (Fall 2019 and Spring 2020 cohort). Providing additional time to think about and plan for teaching ultimately led to the increase in lesson plan quality scores observed in this study, which can ultimately impact what is taught and learned in the SBAE classroom (Ball et al., 2007; Torres & Ulmer, 2007). This positive impact results in increase human capital development (Becker, 1964; Little, 2003; Schultz, 1971; Smith, 2010; Smylie, 1996) within the pre-service SBAE teachers as it relates to teaching.

Recommendations

Based on the study’s findings, it is recommended that teacher preparation programs in agricultural education from across the country evaluate the delivery of their student teaching internship. As this study identified advantages to the increased time spent on learning how to plan for instruction and having additional repetitions, emphasis should be placed on helping pre-service teachers improve their lesson planning abilities in their teacher preparation courses as well as during their student teaching internship. To help facilitate this advantage, a semester-long teaching methods course is recommended, followed by a 15-week student teaching internship. The increased length of student teaching provides additional opportunities for personal growth. In addition to the increased human capital development (Becker, 1964; Little, 2003; Schultz, 1971; Smith, 2010; Smylie, 1996) within students, the new format has lifted the strain of teaching an intensive 4-week block while also managing a regular course load. Considering the conceptual model developed by Ball et al. (2007), the change is recommended to reduce constraints and provide additional opportunities for lesson planning for a positive impact on planning quality. Further, expectations should be placed on cooperating teachers regarding lesson planning. Despite the school district requirements regarding detailed lesson plans, cooperating teachers need to model quality lesson planning for pre-service teachers. Thus, in-service should be conducted with cooperating teachers to outline lesson plan quality expectations as well as train or refresh cooperating teachers on the components of quality lesson planning.

Considering recommendations for future research, additional studies should be conducted evaluating the perceptions of students enrolled in different student teaching formats to determine their view on the impact. It is recommended a nationwide study be conducted to compare lesson plan quality from various student teaching formats across the country. Such a study would provide an opportunity for agricultural education faculty to evaluate their student teaching format against others and refine their process. Although this study focused on the delivery format as the factor impacting lesson plan quality, additional factors such as course sequence, cooperating teacher expectation, university expectation, early field experiences, and planning format, also likely play a substantial role; therefore, additional research should investigate these potential factors further. In doing so, quality metrics should be developed to evaluate how such factors impact the student teaching experience. Finally, although this study was concerned with the effect of student teaching internship on teaching, SBAE instructors have other responsibilities as teachers (Eck et al., 2019; Roberts & Dyer, 2004). Therefore, what effect does the longer student teaching internship have on pre-service teachers’ ability to facilitate a complete SBAE program? Further research should investigate this phenomenon.

Discussion

An integral part of both formats investigated in this study is the development of human capital (Becker, 1964; Little, 2003; Schultz, 1971; Smith, 2010; Smylie, 1996) of aspiring SBAE teachers. The four-week block (2011 to 2012) format provided an intensive, timely experience before students transition to their cooperating center communities and began their 12-week student teaching internship. The immersive four-week experience provides the necessary skills to help improve the student’s competence related to their future career (Heckman, 2000) as an SBAE teacher. In comparison, the 15-week student teaching internship (2019 to 2020) provides an extended on-the-job training opportunity, which has been identified as a major area of human capital development (Schultz, 1961). Although this format extends the student teaching internship, the timely training leading up to the internship is reduced to one week.

Finally, it is imperative that teacher preparation faculty consider the unintended consequences of significant programmatic changes, such as the one described in this study. For example, what is given up or lost as a result of such a change? It is possible that pre-service teachers in the non-equivalent control group had a greater readiness to learn, as they were focused for four weeks on student teaching only. Although the sessions were shorter and more intense, anecdotal evidence suggests the four-week block allowed for a greater sense of community cohesiveness and attention from pre-service teachers than did the longer 15-week internship.

References

Allen, C. R. (1919). The instructor, the man, and the job. Lippincott.

Ary, D., Jacobs, L. C., & Sorensen, C. (2010). Introduction to research in education (8th ed.). Wadsworth/Cengage Learning.

Ball, A. L., Knobloch, N. A., & Hoop, S. (2007). The instructional planning experiences of beginning teachers. Journal of Agricultural Education, 48(2), 56­–65. https://doi.org/10.5032/jae.2007.02056

Baylor, A. L., & Kitsantas, A. (2005). A comparative analysis and validation of instructivist and constructivist self-reflective tools (IPSRT and CPSRT) for novice instructional planners. Journal of Technology for Teacher Education, 13(3), 433–457. Society for Information
Technology & Education. ISSN 1059-7069

Becker, G. S. (1964). Human capital: A theoretical and empirical analysis with special reference to education. National Bureau of Economic Research.

Bond, N., & Peterson, C. L. (2004). Preparing preservice teachers to plan problem-based learning: A qualitative case study of online and face-to-face learning. Action in Teacher Education, 26, 82–96. https://doi.org/10.1080/01626620.2004.10463335

Certification Examinations for Oklahoma Educators. (2020). Tests.

Council for the Accreditation of Educator Preparation. [CAEP]. (2019). 2013 CAEP Standards. http://www.ncate.org/~/media/Files/caep/standards/caep-standards-one-pager-0219.pdf?la=en

Council of Chief State School Officers [CCSSO]. (2013). Interstate teacher assessment and
support consortium InTASC model core teaching standards and learning progressions
for teachers 1.0: A resource for ongoing teacher development.
Author.
https://ccsso.org/sites/default/files/201712/2013_INTASC_Learning_Progressions_for_Teachers.pdf

Clark, C. M., & Peterson, P. L. (1986). Teachers’ thought processes. In M. C. Wittrock (Ed.), Handbook of research on teaching (3rd ed.) (pp. 255–296). Macmillan.

Deeds, J. P., Flowers, J., & Arrington, L. R. (1991). Cooperating teacher attitudes and opinions regarding agricultural education student teaching expectations and policies. Journal of Agricultural Education, 32(2), 2–9. https://doi.org/10.5032/jae.1991.02002

Duke, R. A., & Madsen, C. K. (1991). Proactive versus reactive teaching: Focusing observation on specific aspects of instruction. Bulletin of the Council for Research in Music           Education, 108, 1–14. https://www.jstor.org/stable/40318434

Eck, C. J., Robinson, J. S., Ramsey, J. W., & Cole. K. L. (2019). Identifying the characteristics

of an effective agricultural education teacher: A national study. Journal of Agricultural

Education, 60(4), 1–18. https://doi.org/10.5032/jae.2019.04001

ETS. (2020). The PPAT assessment from ETS. https://www.ets.org/ppa/test-takers/teachers/about

Farrell, T. S. C. (2015). It’s not who you are! It’s how you teach! Critical competencies 
associated with effective teaching. RELC Journal, 46(1), 79–88. https://doi.org/10.1177/0033688214568096

Field, A. (2009). Discovering statistics using SPSS (3rd ed.). Sage.

Franklin, E. A., & Molina, Q. F. (2012). Teacher induction programs in agricultural education: Description of the role of AAAE higher education teacher preparation programs. Journal           of Agricultural Education, 53(1), 123–135. https://doi.org/10.5032/jae.2012.01123

Garton, B. L., & Cano, J. (1996). The relationship between cooperating teachers’ and student teachers’ use of the problem-solving approach to teaching. Journal of Agricultural Education, 37(1), 48–55. https://doi.org/10.5032/jae.1996.01048

Gay, L. R., Mills, G. E., & Airasian, P. (2009). Educational research: Competencies for analysis and applications (9th ed.). Pearson Education, Inc.

Goe, L., Bell, C., & Little, O. (2008). Approaches to evaluating teacher effectiveness: A 
research synthesis. National Comprehensive Center for Teacher Quality

Graham, J. C., & Garton, B. L. (2003). Certification measures: Are they predictive of secondary agriculture teacher performance? Journal of Agricultural Education, 44(3), 54–65. https://doi.org/10.5032/jae.2003.03054

Harlin, J. F., Edwards, M. C., & Briers, G. E. (2002). A comparison of student teachers’ perceptions of important elements of the student teaching experience before and after an 11 week field experience. Journal of Agricultural Education, 43(3), 72–83. https://doi.org/10.5032/jae.2002.03072

Heckman, J. J. (2000). Policies to foster human capital. Research in Economics, 54(1), 3–56. https://doi.org/10.1006/reec.1999.0225

Hillison, J. (1998). The role of the agricultural education teacher educator, yesterday, today, and tomorrow. Journal of Agricultural Education, 39(1), 1–7. https://doi.org/10.5032/jae.1998.01001

Hollins, E. R., & Torres-Guzman, M. E. (2005). The preparation of candidates for teaching 
diverse populations. In M. Cochran-Smith, & K. Zeichner (Eds.) Studying teacher 
education: The report of the AERA panel on research and teacher education
(pp. 201–225). Routledge

Kelleher, R. R., Collins, A. M., & Williams, L. A. (1995). Understanding role and goal problems in early field-experience programs. The Teacher Educator, 30(Spring), 37–46.
https://doi.org/10.1080/08878739509555092

Kitsantas, A., & Baylor, A. L. (2001). The impact of the instructional planning self-reflective
tool on preservice teacher performance, disposition, and self-efficacy beliefs regarding
systematic instructional planning. Educational Technology Research & Development, 49(4), 97–106. https://search-proquestcom.argo.library.okstate.edu/docview/218034286/fulltextPDF/3DAFE0F37D7B4804PQ/1?accountid=4117

Kress, C. A., McClanahan, K., & Zaniewski, J. (2008). Revisiting how the U.S. engages young minds in science, engineering, and technology: A response to the recommendations contained in The National Academies’ “Rising Above the Gathering Storm” report. National 4-H Headquarters and National 4-H Council. https://29bbff09-a-62cb3a1a-s-sites.googlegroups.com/site/4hsetonline/liaisondocuments/CathannKress4HScienceEngineeringandTechnologyPositionPaper_Final_Print.pdf?attachauth=ANoY7crR6m9lch27aURzxQoHQAr7WjWqu0uZxW-LqSG0U1agWrJxx_wlC2o5P3oG9hZUudGKwqcw_Xa3rfsspqiIvlCfnCY-PbbtFyQkrSaQUE1YK16NilfQGOrXsXjocQxAIyaAE4yesc9pvcN0KhGtyx5MQ67TSMdu9KSBRRVWEAibKTlyKvNwYzg9vaRRx7jCqBCgYuWfdujJQImv9Z6NvGjsdAPdQO2WIp61X4H7Ex0NECE6rgINIZps1qffs8_zi6mfylzJDbUj7ONzmoZzf2Z4OG6_JapyH0aooXKd9kFFsSSRm4x0cIQWDpo8zeLYjbLOF&attredirects=0

Little, J. W. (2003). Inside teacher community: Representations of classroom practice. Teachers
College Record, 105
(6), 913–945.
https://www.tcrecord.org/content.asp?contentid=11544

McKee, S. R. (1991). Extent of use of the problem-solving approach by first-year teachers of vocational agriculture (Doctoral dissertation). ProQuest Dissertations & Theses Global.

McLean, R. C., & Camp, W. G. (2000). An examination of selected agricultural teacher
education programs in the United States. Journal of Agricultural Education, 41(2),
23–35. https://doi.org/10.5032/jae.2000.02023

Myers, B. E., & Dyer, J. E. (2004). Agriculture teacher education programs: A synthesis of the literature. Journal of Agricultural Education, 45(3), 44–52.
https://doi.org/10.5032/jae.2004.03044

National Association of Agricultural Educators (NAAE) (2019). 2018 Agriculture teacher supply
and demand overview AAAE regions
.
https://www.naae.org/teachag/2017%20AAAE%20Breakdown.pdf

Oklahoma Commission for Teacher Preparation (2007). Certification examinations for
Oklahoma educators: Oklahoma general education tests: Study guide
. Oklahoma
Commission for Teacher Preparation and Pearson Education, Inc.

Privitera, G. J. (2017). Research methods for the behavioral sciences (2nd ed.). SAGE.

Reiser, R. A., & Dick, W. (1996). Instructional planning: A guide for teachers (2nd ed.). Allyn
and Bacon. ISBN-10: 0205166148

Retallick, M. S., & Miller, G. (2007). Early field experience in agricultural education: A national descriptive study. Journal of Agricultural Education, 48(1), 127–138. https://doi.org/10.5032/jae.2007.01127

Retallick, M. S., & Miller, G. (2010). Teacher preparation in career and technical education: A model for developing and researching early field experiences. Journal of Career and Technical Education, 25(1), 62–75. https://files.eric.ed.gov/fulltext/EJ931090.pdf

Roberts, T. G., & Ball, A. L. (2009). Secondary agricultural science as content and context for teaching. Journal of Agricultural Education, 50(1), 81–91.
https://doi.org/10.5032/jae.2009.01081

Roberts, T. G. & Dyer, J. E. (2004). Characteristics of effective agriculture teachers. Journal of Agricultural Education, 45(4), 82-95. https://doi.org/10.5032/jae.2004.04082

Robinson, J. S., Krysher, S., Haynes, J. C., & Edwards, M. C. (2010). How Oklahoma State University students spent their time student teaching in agricultural education: A fall versus spring semester comparison with implications for teacher education. Journal of Agricultural Education, 51(4), 142–153. https://doi.org/10.5032/jae.2010.04142

Schultz, T. W. (1961). Investment in human capital. The American Economic Review, 51(1), 1–
17. https://www.jstor.org/stable/1818907?seq=3#metadata_info_tab_contents

Schultz, T. W. (1971). Investment in human capital: The role of education and of research.
The Free Press.

Shinn, Y. H. (1997). Teaching strategies, their use and effectiveness as perceived by teachers of agriculture: A national study (Doctoral dissertation). ProQuest Dissertations & Theses
Global.

Smith, E. (2010). Sector-specific human capital and the distribution of earnings. Journal of
Human Capital, 4
(1), 35–61. https://doi.org/10.1086/655467

Smylie, M. A. (1996). From bureaucratic control to building human capital: The importance of
teacher learning in education reform. Educational Researcher, 25(9), 9–11. https://doi.org/10.3102/0013189X025009009

Stronge, J. H., Ward, T. J., & Grant, L. W. (2011). What makes good teachers good? A cross-
case analysis of the connection between teacher effectiveness and student achievement. 
Journal of Teacher Education, 62(4), 339–355.
https://doi.org/10.1177/0022487111404241

Sung, K. H. (1982). The effects of differentially structured lesson plans on the elementary
general music teaching behavior of sophomore music education students
(Doctoral
dissertation). ProQuest Dissertations & Theses Global.

Swanson, J. C. (1971). Criteria for effective vocational education. In G. F. Law (Ed.), Contemporary concepts in vocational education (pp. 21–26). American Vocational
Association.

Sweetland, S. R. (1996). Human capital theory: Foundations of a field of inquiry. Review of
Educational Research, 66
(3), 341–359.
https://www.jstor.org/stable/1170527?seq=1#metadata_info_tab_contents

Swortzel, K. A. (1998). Differences in reason why individuals choose to become agricultural teacher educators by demographic characteristics. Journal of Agricultural Education,
39
(2), 61–72. https://doi.org/10.5032/jae.1998.02061

Swortzel, K. A. (1999). Current status of preservice teacher education programs in agriculture. NACTA Journal, 43(1), 37–43. https://www.jstor.org/stable/43765554

Talbert, B. A., Vaughn, R., & Croom, D. B. (2005). Foundations of agricultural education. Professional Educators Publications, Inc.

Torres, R. M., & Ulmer, J. D. (2007). An investigation of time distribution of pre-service teachers while interning. Journal of Agricultural Education, 48(2), 1–12. https://doi.org/10.5032/jae.2007.02001

Torres, R. M., Ulmer, J. D., & Aschenbrener, M. S. (2008). Workload distribution among agriculture teachers. Journal of Agricultural Education, 49(2), 75–87. https://doi.org/10.5032/jae.2008.02075

Tyler, R. W. (1949). Basic principles of curriculum and instruction. University of Chicago Press.

Oklahoma State University. (2010a). AGED 4113: Laboratory instruction in agricultural education [course syllabus].

Oklahoma State University. (2012a). AGED 4103: Methods and skills of teaching and management in agricultural education [course syllabus].

Oklahoma State University. (2012b). Agricultural education student teacher handbook.

Oklahoma State University. (2018). Oklahoma State University professional education student handbook.

Oklahoma State University. (2019). Agricultural education student teacher handbook.

Wasburn-Moses, L. (2018). An analysis of conditions and trends in student teaching in the United States. Teacher Development, 22(5), 703­–716. https://doi.org/10.1080/13664530.2018.1474130

Young, R. B., & Edwards, M. C. (2006). A comparison of student teachers’ perceptions of important elements of the student teaching experience before and after a 12-week field experience. Journal of Agricultural Education, 47(3), 45–57. https://doi.org/10.5032/jae.2006.03045

Zuch, M. A. (2000). Early training and development initiatives used to recruit for teaching careers: A Texas A&M university study (Doctoral Dissertation). ProQuest Dissertations & Theses Global.

Designing a Technique for Program Expansion of Secondary Agricultural Education

Kendall M. Wright, Rolling Meadows High School

Stacy K. Vincent, University of Kentucky, stacy.vincent@uky.edu

Andrew Hauser, University of Kentucky

Lucas D. Maxwell, Illinois State University

PDF Available

Abstract

Introducing, building support for, and implementing an innovation requires many components of diffusion to be in place. The purpose of this qualitative case study was to investigate the most effective methods for developing new agricultural education programs. Using Roger’s (2003) Diffusion of Innovation model, four themes emerged from information collected in this study: a) identifying stakeholder needs, b) communication, c) education, and d) securing funding. Recommendations include creating informational packets for community members and administrators, hosting webinars to determine best practices, develop relationships with potential stakeholders, and research on additional information desired by secondary stakeholders and the circumstances under which diffusion in agricultural education fails. 

Introduction

When secondary students graduate high school, their next successful transition is career, military, or post-secondary education. For many secondary students, productive dispositions and behaviors, coupled with non-cognitive skills, are most predictive of future earnings (Castellano, et al., 2017). Therefore, emphasis has been placed on college and career readiness through career and technical education programs. A number of educational organizations, including the National Association of State Directors of Career and Technical Education (NASDCTE), the Association for Career and Technical Education (ACTE), and the Partnership for 21st Century Skills, agree that all students in the United States should be college and career ready (Erdogan & Stuessy, 2016). However, the U.S. Department of Education (2010) reported that approximately 40% of all college freshmen are enrolled in remedial courses. To address this, schools have placed a greater emphasis on providing education which better prepares students for the transition from high school to higher education, the workplace, and/or the military. To ensure all students, regardless of geographic location, were indeed prepared to be college and career ready after completing their education in a public school, Common Core State Standards were developed in 2009 (Center for American Progress, 2014). In addition, common assessments were designed to measure the college readiness of secondary students (McIntosh, 2010). Although measuring college readiness is advancement in education, simply measuring readiness will not develop curriculum which allows students to pass. Instead, it is vital to also develop programs designed to produce career readiness in addition to college readiness, and to do so in a program that is available to all secondary students.

Along with conventional academic subjects, schools are turning to career and technical education courses to facilitate the development of college and career readiness. Not only does career and technical education provide knowledge and skill sets for students, but it also introduces potential career fields, as evidenced by a study in New York that revealed over half of middle school participants identified areas of interest that were representative of the agriculture, food, fiber, and natural resources industry (Conroy, 2000).

Secondary agriculture courses provide opportunities for a variety of learners to excel and succeed in an educational setting. This can be seen in a study completed by Roberts, Hall, and Briers (2009) in which new agricultural programs in Texas schools encouraged Latino students to become more active in their education by joining and participating in an intracurricular program. Furthermore, parents of the students and alumni from the area became more active in the students’ education. Access to a teacher who provides intracurricular opportunities, such as an agricultural educator, help at-risk students improve their GPAs and narrow the achievement gap (Herrick, 2010). 

Career and Technical Education (CTE) not only helps engage minorities and at-risk students, but it also helps to increase the high school transition rate. According to Wells, Gifford, Bai, and Corra (2015), only 75% of public high school students earn a diploma within four years of entering the ninth grade. Fortunately, research infers students who enroll in career and technical education demonstrate higher levels of engagement, leading to a reduction in the probability of the students dropping out of school and improved levels of academic performance (Evan,et al., 2013). In the 2013 study, the researchers identified the geographic location of all career academies in public schools in Florida in order to determine the type of student most likely to enroll in the career and technical education classes, as well as school information such as dropout and student engagement rates, and then compared those numbers to geographic areas which did not offer career academies. They found that enrollment in career and technical education gives students an advantage in academic and career success. Furthermore, in a study by Neild, Boccanfuso, and Byrnes (2015) determined that increased engagement in and out of the CTE classroom was correlated to a reduction in disciplinary referrals.

All students can benefit from completing a course in career and technical education. In a study completed by Hagen (2010), every student in one high school completed at least one career and technical course per year. As a result of being enrolled in the course, the study revealed student engagement, achievement, student transitions, attendance rates, dropout frequency, graduation potential all improved. In addition, students developed a higher level of self-confidence and competence. Once students experience the development of their self-confidence, they experience a higher level of motivation (Eggen & Kauchak, 2010). Those who completed agricultural courses demonstrated a higher need for achievement than those students who did not complete an agricultural course. Furthermore, participants who completed agricultural courses and joined the local FFA chapter demonstrated an even higher need for achievement (Herren & Turner, 1997).

With the benefits from agricultural education courses that ensure the development of college and career readiness, an expectation for program expansion should be a priority; however, 15 states have seen the number of agricultural programs decrease since the 2011-2016 academic year. The remaining states had an average increase of 12.6 programs per state, with 67% of that growth coming from ten states (National FFA Organization, 2017). What are the high growth states doing to increase the number of programs, and to provide secondary students with the opportunity to succeed?  Why aren’t states employing methods to produce more career and technical, and specifically agricultural, programs? This study focuses on obtaining answers to those questions so that all secondary students can experience the benefits of agricultural education.

Conceptual/Theoretical Framework

The guiding theory of this study is Rogers’ Diffusion of Innovations (Rogers, 2003). An innovation is defined as a new idea, product, or method as perceived by an individual or group of people (Rogers, 1983). According to Rogers (2003), an innovation is adopted after a need is determined. The Diffusion of Innovations Theory describes the necessary means for an innovation to be adopted by a group of people. Rogers (2003) described diffusion as a process where innovation is communicated through various methods over time among the members of a social system.           

Diffusion can only occur when certain elements are present. Specifically, there are four essential elements for diffusion to occur. The source, or the entity presenting the innovation, provides two of those elements: the innovation itself and the communication of the innovation. The communication presented by the source must be through distinct channels, which connect the source to the social system in which the innovation is being presented. These channels can include mass media (television, social media, etc.) and/or interpersonal interactions (face to face meetings). According to Rogers (2003), the most effective channel for innovation is an interpersonal channel in which someone of similar status (age, education, etc.) completes a subjective evaluation of the innovation after adopting it themselves. People of similar status are referred to as “near peers”. The third element, time, occurs throughout the process as the fourth element, a social system, or adaptor, considers the innovation before it decides to diffuse the innovation (Rogers, 2003). Figure 1 provides a visual interpretation of the Diffusion of Innovation.

Figure 1

The four elements (innovation, communication through certain channels, time, and social systems) play roles in different stages of diffusion (Rogers, 1983). The knowledge stage is completed when the source communicates to the social system about the existence of the innovation and provides a basic understanding of said innovation. An example of how these stages can be seen in an educational setting can be found in a study by Hagen (1999) in which Valley City State University adopted a learning environment in which an innovation curriculum computer program was utilized. In this environment, all faculty and students were given laptops with constant access to the internet. The music department of the university entered the knowledge stage when they learned about what the technology could offer their department. As faculty learned about the possibilities, they entered the persuasion stage during in which they evaluated their initial impressions of the innovation. In this case, positive impressions were developed. The decision stage was completed when faculty began to create curriculum for the music department. The curriculum was implemented, and students focused on five innovative areas via the new environment: communication and aesthetic responsiveness, problem solving, effective citizenship and global perspective, collaboration and wellness, and technology (Hagen, 1999). 

Barriers can prevent the adoption of an innovation, and different barriers arise in different stages. Nelson and Thompson (2005) studied the diffusion of new technology into distance learning programs. When asked what the biggest barriers were to the adoption of the new technology, about 40% of teachers agreed the lack of adequate compensation for time and effort of the faculty was a major barrier. About 35% of respondents agreed the lack of faculty rewards/incentives was a major barrier and one-third of teachers agreed program development costs were also a major barrier to innovation.

Purpose and Objectives

The purpose of this qualitative multiple case study was to determine the most effective methods for program expansion of new agriculture education programs. The research questions were:

  1. What methods of diffusion are utilized in the conception and implementation of new agricultural education programs, as described by leaders in state associations?
  2. What barriers must be addressed to establish new programs?

Methods and Procedures

This study is a qualitative case study in nature, as designed by Denzin and Lincoln (2008). Case studies investigate a phenomenon, population, or general condition, which is common between different cases (Creswell, 2009). Case studies facilitate the conveyance of a participant’s experience to the researcher.  Case studies are chosen because it is believed that understanding them will lead to a better understanding about a larger collection of cases (Yin, 2008). In this study, the researchers investigated a series of phenomena, common in multiple states. The researchers sought to obtain detailed information about the methods and communication channels used when launching new agricultural education programs throughout the United States.

Participant Selection

Ten states served as the sampling frame for this study due to their growth of secondary agriculture programs. Each participant selected was chosen or nominated because of his or her affiliation with the state’s growth. Achieving the best understanding of phenomena depends on choosing the best cases to study (Denzin & Lincoln, 2008). In this research study, the participants were selected based upon a series of standards set by the researchers. With the help of the National FFA Organization, ten participants met a predetermined series of qualifications. Qualifications for participant selection were as follows: represent a state which obtained a 10%+ chapter growth over a seven-year period at the time of growth and was employed by the state FFA association or by the state’s Department of Education. The selected states had a growth range from 21 to 43 programs.

Researchers selected participants because 1) their state was one of the top 10 states to experience  a growth of 10%+ in the last seven years in secondary agriculture programs; and 2) they were the considered instrumental in the state programmatic expansion by their peers. Three states considered a team of individuals were responsible for the state’s growth. The researchers selected to interview the group of individuals within the selected states in a focus group interview; thus, each state’s selected participant(s) partake in an interview.

Procedures

The researchers focused on obtaining information about the growth of agricultural education programs over the past two decades. The National FFA Organization was contacted and information for the past seven years was provided. The National Association for Agricultural Education did not have an accurate count of agricultural education programs; therefore, the frame was limited to growth over the past seven years. The number of FFA programs were compared for all state associations from the 2010-2011 and 2017-2018 academic years. Because there must be an agricultural education program in place in a school before an FFA chapter could be started, the researchers decided the number of FFA chapters in a state was an accurate method for determining the highest growth.

Semi-structured interviews were completed, with each participant being interviewed for approximately one hour. The open-ended questions used in the interview were structured and centered on the individual’s views and experiences planning and implementing new agricultural programs, as it aligned with Rogers’ (1983) model. Following Yin’s (2018) framework of questioning, the researchers gradually modified their questions to transition from Level 1 questioning to Level 4 questioning. Pre-established prompts were used, but the order in which the questions were asked depended upon the participant’s responses. Furthermore, clarifying and elaborating probes were utilized as needed in order to provide further explanations and seek more detail in participant responses. The interviews took place over the phone and were audio-recorded.  Throughout the interview, the moderating researcher took field notes of reactions from the participant and researcher. After each interview was completed, the researcher expanded on the field notes in a reflective journal. Each interview was transcribed for analysis. 

Data Analysis

This data from this study consisted of field notes, taped interviews, transcribed interviews, and journals of personal reflections over the interview. Once all data were collected, researchers read and reread the data to become more familiar with them. Then, the researchers independently and systematically coded the data by identifying phrases and topics which consistently were mentioned in the data. Next, researchers used axial coding to create themes from the codes through the iterative method of recursive analysis. By utilizing recursive analysis, researchers constantly compared each piece of data to the prior pieces of data in order to ensure the themes were representative of the data (Yin, 2008). The researchers coded the thematic responses following Rogers’ Diffusion of Innovations to develop assertions. To add multiple perceptions to the analysis of the data for the enhancement of validity and credibility to the results, triangulation was utilized throughout the procedures. 

Trustworthiness

After all interviews were conducted, audio recorded, transcribed verbatim, and field notes written and expanded upon in a journal, the researchers independently coded data and then compared results. Peer debriefing was utilized from an outside source throughout data collection and the coding process as an impartial colleague was asked to review methodology. Furthermore, the researchers independently coded the data and then compared results. This created inter-rater reliability, which enhances thematic credibility (Denzin & Lincoln, 2008; Saldena, 2009). To increase the trustworthiness of this study, member checking was utilized. Each participant was given a copy of the findings and asked to confirm the results, creating data confirmability (Denzin & Lincoln, 2008). Follow-up phone calls were conducted to each participant to verify the content of their interview. Finally, the findings and conclusions were sent to the participants for validation. Overall, the researchers established credibility of the data using reference materials, peer debriefing, and member checking. 

Triangulation and Bracketing

Triangulation is the simultaneous display of multiple realities (Denzin & Lincoln, 2008). Data source triangulation, which is the use of multiple sources of data, were utilized in this study. There were three major types of data: interviews, field notes, and a reflective journal kept by the researchers. Investigator triangulation was also used. Because the researchers have not experienced the same events as the participants, there are multiple realities, which could lead to bias from the researchers. In order to prevent bias in this study, the background of the researchers should be addressed. The two researchers are involved in agricultural education. One researcher is involved in teacher education and taught at the secondary level for seven years prior to beginning his career at the collegiate level. The other is a current agriculture teacher who has four years of experience and is currently working on a PhD in Curriculum and Instruction. Investigator triangulation was utilized in all interviews and interactions with participants to minimize the influence of biases. This was achieved through independent coding and the maintenance of a reflective journal to describe the interactions between the researcher and the participants and to note any biases. 

Findings

For all findings, participants have been given alias names. Research question one sought to determine what methods of diffusion are utilized in the conception and implementation of new agricultural education programs. For this objective, two themes emerged.

Theme 1: Identify potential stakeholders and their needs

Throughout the interviews, participants emphasized the importance of identifying stakeholder needs. Several different stakeholders were identified, and three subgroups emerged.  The first group is community members ranging from parents, students, alumni, to legislators. The second group is school officials, ranging from administrators, school board members, superintendents, and the Department of Education. The third group included important people in the agriculture industry, such as farmers, Farm Bureau, the Department of Agriculture, sponsors, and other agribusinesses. These different groups of stakeholders have different needs for an agricultural education program. For example, a farmer would want an agricultural education program that would focus on production agriculture. However, an urban community would want an agricultural program to focus on urban agriculture and sustainability. A school administrator would want a program that would appeal to students, parents, and testing scores. Participants in the study emphasized the importance of first building a relationship with and then helping stakeholders to identify their needs and then providing them with the necessary tools and resources to advocate and build support for an agricultural education program in their community. Table 1 includes supporting statements from participants.

Theme 2: Communication is a method of entry

An important part of building relationships with stakeholders is communication. In each interview with participants, communication was a factor in creating and implementing new agricultural education programs. Two sub-themes emerged under this umbrella: methods of communication and resources in communication. Methods of communication varied, but a theme emerged with the most popular ones. Participants overwhelmingly responded that face-to-face meetings were the most effective methods of communication. However, participants recognized the need for other methods of communication, such as emails and telephone calls. For communication with students, the participants reported social media, including Facebook and Twitter, were the most effective method. Participants also listed several documents and online resources they utilize in order to implement new programs. These resources include student surveys, educational literature about agriculture and agricultural education, course standards, websites with information about agriculture courses and opportunities in FFA, and letters. State officers are also used as resources. Additional resources mentioned include grants for new programs, time placed into working with new programs, conference calls and webinars for teachers in new programs, leadership training for officers of new programs, state staff designated to help a region of teachers, and an employee who visits new programs and provides assistance as requested.   Table 2 includes supporting statements for this theme. 

Research question two sought to identify what barriers had to be overcome in order to implement new agricultural education programs.  For this objective, two themes emerged.

Theme 1: Overcoming educational barriers

When asked about barriers to creating and implementing new agricultural education programs, participants responded one barrier was the education of communities. Two sub-themes also emerged.  The first sub-theme is the education of the community (including all stakeholders) about the importance of agriculture. This was especially noted in urban and suburban areas as many people in those areas are unaware of the importance of agriculture in their community. However, in order to begin new programs, the community must see value in agriculture in order to develop a need for an agricultural education program. Participants spoke about how their first task in beginning new programs was to establish validity and importance for agriculture. The second sub-theme is the education of school officials, including administrators, school board members, and superintendents, about the difference between agricultural education and FFA.  Several participants spoke about schools that wanted to start an FFA chapter, but were unaware they had to have an agricultural education program first. Participants spoke of the importance in making school officials understand the importance of agricultural education, and not just the FFA component. Table 3 gives quotes from participants about community education.

Theme 2: Addressing financial support issues

 Overwhelmingly, the biggest barrier participants reported having to overcome is the lack of funding, or trying to find funding for new agricultural education programs to start. In most states, agriculture teachers are paid for extended days or they are paid on ten to twelve month contracts because they work with students throughout the year, regardless of whether or not school is in session. Because of this, many states have passed legislation that allows agriculture teachers to be paid for this time. In addition to paying a higher salary to a teacher, agricultural programs require additional facilities. For example, some schools have Agriscience labs or shops. Other schools have farms for their students. No matter what facilities are chosen for a program, it is an investment for schools, and many schools have struggled to find funding for new programs. The economic downturn, beginning in 2008, has also made it hard for schools to find funding for new programs. Table 4 provides participant responses on the funding barriers.

Conclusions, Implications, & Recommendations

The researchers recognize the limitations to this study and acknowledge that the findings were based upon the stories of a few individuals who were instrumental to the significant growth of program expansion in their state. However, this study did not include members of the community where the programs began, members of the organizations that further assisted with the growth, nor governmental or school officials that assisted with program expansion. Furthermore, the study is viewed from the lens of the authors who took a pragmatic worldview; hence the use of Roger’s model as a guide. Nevertheless, the findings from this study were implemented which have resulted in program development and expansion of programs within the Commonwealth of Kentucky. Of the programs developed, all have maintained partnerships with the community agency and are still present in secondary schools.

Although no community is the same and agricultural programs were not be created and implemented homogenously, there are similarities in the diffusion process. From this study, it was concluded that one of the first steps in creating new programs is to identify the needs of all stakeholders, including the community members, school officials, and industry representatives. Another important part of the process is to use the most effective communication channels possible. Although all types of communication are used (phone, email, letter, etc.), the most effective method of communication is face-to-face meetings. Resources must be used efficiently as well, in order to increase the understanding of agricultural education for the school officials and community. Resources that are utilized include websites, documents, student surveys, etc. 

The need for stakeholders serves as Channels to Rogers’ (1983) Diffusion of Innovation Theory. These stakeholders are the voice box for promoting the start of the agricultural education program from within a community. Various organizations serve as fundamental platforms and provide opportunities for community members to encourage the promotion of a secondary program within a school. To begin the process of innovation, agricultural education state staff members who are looking for the correct channel should consider meeting with various advocate groups that can assist in the process. Examples of organizations to be contacted, but not limited to, are the local Farm Bureau, the National Association of Agricultural Educators, and the local Chamber of Commerce. Each serve as interpersonal channel that could open opportunities for an agricultural education program to exist. Based upon Rogers’ model, the interpersonal channel the participants made, had a great impact on the adoption of new program expansion.

State staff members are recommended to build relationships with community leaders, administrators, and leaders in the agricultural industry prior to program proposals. Once established, the relationships serve as additional adopters for promoting and advocating the implementation of new agricultural education program. In addition, states with an interest in program expansion should seek to increase support at the state level. In this study, participants expanded upon utilizing trained support, such as state officers or teachers in the state, to further help in explaining the benefits and developing supportive networks. From the findings, it is recommended that states with the desire of program expansion seek opportunities to gain help by providing professional development in the area of advocacy. Such professional development could be provided to teachers within the state, state officers, alumni, and members of Foundation boards.  Building support by developing relationships with adopters is vital in getting a community to adopt an innovation (Rogers, 1983).

Communication in this process occurs through various ways, including phone calls, email, letters, etc., but the participants overwhelmingly agreed that face-to-face meetings are the most effective way to implement new programs. However, the main key is that an initial contact be implemented. For example, in a study utilizing Diffusion of Innovation Theory, small businesses who showed the most growth made various efforts to contact potential clients (Nooteboom, 1994). Resources that are crucial to share include student surveys, information about agriculture and agricultural education, agricultural education and FFA websites, and examples of other successful agricultural education programs in an area like the school which is considering a program. Currently, the National FFA Organization provides opportunities for administrators of non-agricultural education programs to attend the National FFA Convention to understand the value of the profession. Each state is encouraged to consider opening the door of their State FFA Convention to administrators of schools. Through these methods, communication serves as a source to the Diffusion of Innovation Theory (Rogers, 1983).

If support for agricultural education could be raised in school systems that do not currently have programs, they would be much more likely to implement one. Therefore, it is recommended that advocates for agricultural education programs should target school administrators to encourage implementation. To best implement the recommendation, face-to-face meetings are suggested, based upon the findings.  In addition, different resources, such as community, financial, industrial, and collegial, are beneficial if established prior to meeting. The establishment of such resources solves for barriers that may limit the social system (Rogers, 1983).

To fulfill Rogers’ Diffusion of Innovations Theory more efficiently in the context of agricultural education program development, it is recommended that stakeholders develop educational materials for individuals seeking to propose new agricultural education programs. Similarly, Roberts, et al. (2009) determined that new curriculum was needed for program expansion in Hispanic serving program where Roger’s model was implemented. These educational materials could consist of, but are not limited to, creative program support information, beneficial results from agricultural education, and correspondence from administration of successfully started programs.

It was concluded that the development of a new program is costly and such cost may sometimes be detrimental to its development. Therefore, supporters of agricultural education, such as National Association for Agricultural Education (NAAE) and its state affiliates, should lobby to state legislatures in the development of funding resources for establishing new programs. Such funding sources, such as the STAR program, would assist in addressing barriers and further securing a commitment between administration and agricultural education stakeholders.

To help understand the emerging themes, the researchers developed the Agricultural Education Program Development Concept Model (Figure 2). It was concluded from the results in this study that the model best represented what the participants conceptualized for their success in program expansion. Each of the four emerging themes are all linked together in the process of program expansion. Although time is necessary in the development of a new program, stakeholders must be involved, funding sources need to be addressed, a clear and open flow of communication has to exist, and the school or profession must identify and extinguish educational barriers.

Figure 2
Agricultural Education Program Development Concept Model

It is important to note that this model is merely a visual representation of how the participants in this study conceptualize program expansion. It is recommended that the model serve as a guide toward the development of questionnaires in exploring and validating the findings in this study.

The National FFA Organization, in partnership with NAAE, are encouraged to host a series of webinars in which state leaders, such as the participants in this study, collaborate and share their ideas for new program expansion. The purpose of the webinar would be to create a list of best practices for distribute to all associations, which could then be utilized in the creation and implementation of agricultural education programs across the nation.

To provide opportunities for all students in all schools to become college and career ready, programs which provide that type of preparation must be available, including agricultural education. By following Rogers’ (1983) Diffusion of Innovation Theory and ensuring all necessary stakeholders are involved, clear and effective communication is presented, and options to overcome barriers are developed, it is possible to help schools adopt this innovation and improve the education provided to their students.

References

Brown, N. R., & Kelsey, K. D. (2013). Sidewalks and city streets: A model for vibrant agricultural education in urban American communities. Journal of Agricultural Education, 54(2), 57-69. https://doi.org/10.5032/jae.2013.02057

Castellano, M., Sundell, K. E., & Richardson, G. B. (2017). Achievement outcomes among high school graduates in college and career readiness programs of study. Peabody Journal of Education, 92(2), 254-274. https://doi.org/10.1080/0161956X.2017.1302220

Center for American Progress. (2014). Common core state standards assessments: Challenges and opportunities. https://eric.ed.gov/?id=ED561091

Conroy, C. A. (2000). Reinventing career education and recruitment in agricultural education for the 21st century. Journal of Agricultural Education, 41(4), 73-84. https://doi.org/10.5032/jae.2000.04073

Creswell, J. W. (3 Ed.). (2009). Research Design: Qualitative, Quantitative, and Mixed Methods Approaches. SAGE Publications.

Denzin, N. K., & Lincoln, Y. S. (2008). Strategies of Qualitative Inquiry. SAGE Publications.

Eggen, P., & Kauchak, D. (2010) Educational psychology: windows on classrooms. Pearson Education, Inc.

Erdogan, N., & Stuessy, C. (2016). Examining the role of inclusive STEM schools in the college and career readiness of students in the United States: A multi-group analysis on the outcome of student achievement. Educational Sciences: Theory and Practice, 15(6), 1517-1529. https://doi.org/10.12738/estp.2016.1.0072

Evan, A. J., Burden, F. F., Gheen, M. H., & Smerdon, B. A. (2013). Explaining variability in high school students’ access to and enrollment in career academies and career theme clusters in Florida: Multi-level analyses of student and school factors. Career and Technical Education Research, 38(3), 211-243. https://doi.org/10.5328/cter38.3.211

Hagen, S. L. (1999). Technology diffusion and innovations in music education in a notebook computer environment. Research Proceedings of the 1999 Society for Information Technology & Teacher Education International Conference. San Antonio, TX. 

Hagen, S. N. (2010). The effects of mandated Career and Technical Education (CTE) on the college and career preparation of high school students. (Doctoral dissertation). Purdue University, West Lafayette, IN.

Herren, R. V., & Turner, J. (1997). Motivational needs of students enrolled in agricultural education programs in Georgia.  Journal of Agricultural Education, 38(4), 30-41. https://doi.org/10.5032/jae.1997.04030

Herrick, C.J.  (2010) The impact of an advisor-advisee mentoring program on the achievement, school engagement, and behavior outcomes of rural eighth grade students. (Doctoral Dissertation) University of Nebraska, Omaha, NE.

McIntosh, S. (2010). State high school tests: Changes in state policies and the impact of the college and career readiness movement.  Washington, DC: Center on Education Policy.

Nield, R. C., Bocannfuso, C., & Byrnes, V. (2015). Academic impacts of career and technical schools. Career and Technical Education Research, 40(1), 28-47. https://doi.org/10.5328/cter40.1.28

Nelson, S. J., & Thompson, G. W. (2005). Barriers perceived by administrators and faculty regarding the use of distance education technologies in preservice programs for  econdary agricultural education teachers. Journal of Agricultural Education, 46(4), 36-48. https://doi.org/10.5032/jae.2005.04036

Nooteboom, B. (1994). Innovations and diffusion in small firms: Theory and evidence. Small Business Economics, 6(5), 327-347. https://doi.org/10.1007/BF01065137

Roberts, T. G., Hall, J. L., & Briers, G. E. (2009). Engaging Hispanic students in agricultural education and the FFA: A 3-year case study. Journal of Agricultural Education, 50(3), 69-80. https://doi.org/10.5032/jae.2009.03069

Rogers, E. M. (1983). Diffusion of Innovations. Macmillan.

Rogers, E. M. (5 Ed.). (2003). Diffusion of Innovations. Macmillan.   

U.S. Department of Education. (2010). A blueprint for reform: The reauthorization of the elementary and secondary education act. Education Publications Center.

Wells, R., Gifford, E., Bai, Y., & Corra, A. (2015). A network perspective on dropout prevention in two cities. Educational Administration Quarterly, 51(1), 27-57. https://doi.org/10.1177/0013161X13511110

Yin, R. K. (2018). Case study research and applications: Design and methods. SAGE.

Georgia Extension Agents’ Perceptions of Rural Stress

Jessica Holt, University of Georgia, jaholt@uga.edu

Madison Crosby, University of Georgia, mec14669@uga.edu

Kevan Lamm, University of Georgia, KL@uga.edu

Abigail Borron, University of Georgia, aborron@uga.edu

Alexa Lamm, University of Georgia, alamm@uga.edu

PDF Available

Abstract

Rural populations, including farmers, are often disconnected from more populated areas. This disconnect includes access to healthcare and resources to address stress and mental wellbeing. Stress has been shown to lead to increased suicide rates and substance abuse. Because Extension agents are often a trusted source of information within these rural communities, identifying rural communities’ levels of stress is an essential step in creating programmatic efforts to address mental health disparities with these individuals. Utilizing a 10-item survey, Georgia agents’ perceptions of stress/mental health in their communities were measured. The survey results of 281 agents (90% response rate) were analyzed for means and frequencies to better understand what specific factors associated with stress/mental health may be the most pressing for rural communities. The findings indicate the level of stress varies by location within the state. This finding indicates programmatic efforts and future research may need to target specific location needs given the unique needs of the audience, rather than a one-size-fits-all approach.

Introduction

With agriculture being the largest industry in Georgia, contributing $73.3 billion annually to the state’s economy (Kane, 2019), the farming population of the state is relied upon heavily to sustain a significant contribution to the state’s economic viability. With such a large portion of the state’s economy dependent upon the success of its rural communities, it only stands to reason the health and wellbeing of those involved in agriculture would be a forefront of consideration. However, little research or programmatic efforts have been solely focused on understanding the impacts mental health and stress play on rural communities, specifically farming communities.

According to the U.S. Census, rural is defined as “all territory, persons, and housing units not defined as urban” (Ratcliffe et al., 2016, p. 2). In 2010, this defined area accounted for approximately 97% of the U.S. land area and 19.3% of the population (Ratcliffe et al., 2016). According to the most recent documents, in Georgia during 2012, 38.6% of the state’s land was used for agricultural purposes and in 2018, 17.1% of its population occupied rural lands (Rural Health Information Hub, 2019). As the demands and challenges of production agriculture continue to grow and unfold, rural communities become ever increasingly essential.

Over the last decade, a prevalent issue in rural U.S. communities has become mental health and stress (Centers for Disease Control, 2019a). Primary indicators of this issue are documented in the increase of pharmaceutical addiction and suicide rates (Centers for Disease Control, 2019b; Centers for Disease Control, 2019d). With approximately 46 million individuals living in these rural areas, this level of social disparity is observable, but often overlooked Centers for Disease Control, 2019c). In 2018, 13.9 suicide deaths per 100,000 people within the population of Georgia were reported (America’s Health Rankings, 2019). Additionally, the Centers for Disease Control and Prevention has reported an increased risk of suicide in rural areas than urban populations (Clay, 2014). Experts have attributed this increased risk due to higher use of drugs and alcohol, with fewer health care providers and hospital access, as well as access to firearms (Clay, 2014). This increased risk poses many risks to the overall health and vitality of rural communities. In the following section, considerations to rural stress/mental health within rural communities is expounded upon to further elucidate the issues mentioned above.

Conceptual Framework

The boundaries of rurality can often be visually depicted with open fields along a highway; however, much like mental health the definition of rural is much more complex and divisive. While the U.S. Census Bureau defines rural as not urban, and defines urban as those areas with 50,000 or more residents (Ratcliffe et al., 2016) other sources apply culture, lifestyle, and clusters of residents (Ratcliffe et al., 2016; Vanderbroom & Madigan, 2007). The current study was not developed to add validity to a definition of rural, rather to recognize that the needs and barriers of those residents in less densely populated areas, specifically farming areas, are different than those in urbanized areas.

Rural Culture

With pharmaceutical addiction and suicide rates on the rise in rural communities, the need to identify the associated catalyst is essential. One contributing stressor is the overall work environment. By working and living in isolated areas and having little time away from work, farmers have minimal separation between work and personal life (Gregoire, 2002). In addition, the farming community can include living in small, tight-knit rural communities, which can lack privacy. These factors can create additional stress and exhaustion, which can lead to accidents (Naik, 2017). Compounding that stress, agriculture and farming have unique and variable factors that can add stress and uncertainty. For example, Kolstrup et al (2013) identified that dairy farmers have stressors such as diseases related to livestock, taxes on their production, and negative attitudes of the public toward their practices. These stresses can take a toll on mental health and wellbeing, leading to self-prescribed methods of coping (Clay, 2014; Gregoire, 2002; Naik, 2017).

When seeking assistance for issues related to mental health, male farmers experience barriers like distance to appointments, lack of financial access for help, and stigma associated with mental health and treatment or help-seeking behaviors (Roy, Tremblay, & Robertson, 2014). Research has demonstrated that sometimes in the farming community, the idea of the masculine farmer as tough and self-reliant can conflict with individuals seeking help for mental health issues, which can be construed as a sign of weakness (Naik, 2017). Education, and especially educating young people, in rural areas can help destigmatize mental health and the act of seeking mental health help (Gregoire, 2002). Research has recommended for both governmental and non-governmental organizations to assist with mental health education, awareness, and stigma associated with mental health (Gregoire, 2002).

In New Zealand and Australia, research has recommended implementing preventative programming, online initiatives, events, workshops, and publications to encourage a discussion about mental health in the agricultural industry (Naik, 2017). Mental health programming can assist in opening the conversation and breaking the taboo about mental health in the communities (Naik, 2017), as well as enhance the ability to recognize the signs of mental health issues (El-Amin et al., 2019).

Additionally, farmers are more likely to seek services from people and organizations they trust for health-related information (Kilpatrick et al., 2012). As such, mental health programs need to continue to be outside of traditional medical facilities to help with health in rural and farming communities (Roy et al., 2014). The inclusion of community member volunteers can help with small group counseling sessions and encourage participants to feel more open to expressing their concerns due to their familiarity and living in the same rural community (Thompson & McCubbin, 1987). Research has found that mental health promotion might be better disseminated through other non-governmental networks since most farmers visit their physicians only to deal with obvious physical issues (Gregoire, 2012).

A farmer’s family and other social support systems can help farmers’ deal with stressors they face (Anderson et al., 2012; Fraser et al., 2005). Other close relationships, such as friendships, can help farmers and serve as a coping device to deal with stress (Roy et al., 2014). For example, role models have been found to play an important role in helping address male farmers’ distress and promoting help-seeking behavior for mental health (Roy et al., 2014). Additionally, finding trusted relationships where farmers seek out confidants in their community beyond their immediate farming peers has shown to be important (Roy et al., 2014). Overall, mental health services need to be made more accessible to farmers in a comfortable, trusted environment with trusted people (Polain et al., 2011).

Rural Healthcare

In addition to the individual and contextual challenges associated with rural environments, there are also systemic challenges associated with the rural healthcare system. For example, rural healthcare workers have stressors related to being overbooked with clients, working in multiple locations, a lack of support in staffing due to a high-turnover rate, and frustrations with technology (Hasbrouck & Waddimba, 2017). Research has suggested that healthcare organizations should invest in programming and mentoring to help healthcare workers maintain their health to care for patients, cope with stress, and deal with the stigma of someone receiving help (Hasbrouck & Waddimba, 2017). Previous research demonstrated that mental health services need to be made more accessible, especially to farmers who work closely on their land or who lack mobility (Polain et al., 2011). Additionally, farmers feel physicians need to understand their culture better to treat them more effectively and recognize the risks involved with the integrated relationship between their careers and lifestyle choices (Anderson et al., 2012). Nevertheless, there has been an observable trend to increase mental health literacy and programming in the United States in both rural and urban settings; however, there remains a gap in curriculum catered specifically to rural areas and the nuanced challenges associated within them (El-Amin et al., 2019).

Role of Extension

During the economic crisis in the 1980s, local Extension agents faced many community members dealing with substantial financial loss, changes in their social structure and network, and uncertainty in the future (Molgaard, 1997). People turned to Extension for support because they were viewed as a valued source of information, and people in rural areas trusted their agents during these challenging times (Molgaard, 1997). Programs were set up through the Cooperative Extension Service to develop plans to help farm families come up with strategies to cope and identify stressors through the use of counselors, both professional or peer-trained, to help farm families deal with emotional and physical stress (Thompson & McCubbin, 1987).

In the past, Extension agents have shown to be vital to connecting and engaging the farming community with the health care professional community (Guin et al., 2012). Extension provides access to education that can promote health education while decreasing the health disparities in rural communities (Fitch et al., 2013). Extension agents can serve as change agents, who communicate desired change to others in a community and, with the assistance of volunteers, can help with health education (Rogers, 2003; Wang, 1974). Training designed to improve the capacity of knowledge for Extension agents to identify and deal with mental health issues can result in agents feeling more comfortable dealing with community members, including farmers, who indicate signs of mental health issues (Hossain et al., 2010). In some communities, county Extension agents are trained similarly to community health workers and are ingrained in the local culture (Fitch et al., 2013). Individuals working in healthcare in the communities, such as doctors, might then be able to connect with county Extension agents to create a community-based partnership and help give more robust healthcare access to rural areas (Fitch et al., 2013).

Need for More Literature

 A gap exists in research related to mental health prevention and treatment programming through university Extension in the United States. A large portion of the existing literature base is associated with Australia and New Zealand research associated farmer mental health programming reacting to climate change stressors (Brew, Inder, Allen, Thomas, & Kelly, 2016) and major climatic disasters such as drought (Fuller et al., 2007; Hanigan, Schirmer, & Niyonsenga, 2018; Hossain et al, 2010). Additionally, studies examined India’s agrarian crisis from a national economic crisis in the agricultural industry; however, this research did not specifically focus on issues associated with mental health (Merriott, 2016). There is a need for additional studies on mental health in farmers and farming communities (Gregoire, 2002), as well as evaluating how farmers’ resilience positively affects their mental health in comparison to other population segments (Fraser et al., 2005; Berry et al., 2011). Research within agricultural communities related to mental health would provide a foundation for future programming, both within the context of Extension as well as outside of the extension domain (Gregoire, 2002).

Purpose and Objectives

The purpose of this research was to quantitatively understand the needs and perceptions of Georgia Extension agents about the current state of rural stress and mental health within their rural communities. By capturing the current state of rural stress within their communities, research and programming can be implemented to provide resources and initiatives to serve the communities through Extension.

Two objectives were guiding this research: (1) Identify Georgia Extension Agents’ perceptions of rural stress within their counties to evaluate agents’ comfort and need for programming related to rural stress and mental health for their communities; (2) establish baseline data for Georgia Extension to understand the current state of rural stress and mental health within individual districts.

Methodology

Employing a descriptive research design to better explore Georgia Extension agents’ perceptions of farmer/rural stress, the current study utilized quantitative measures. During a mandatory, annual training, for all Georgia agents in fall 2018, the researchers collected both quantitative and qualitative data to explore the concept of rural stress/mental health in Georgia. For this study, only one scale within the survey is addressed. All agents were required to attend an all-day workshop, where the concept of rural stress/farmer mental was discussed during a 30-minute portion of the day. The agents were asked to participate in an activity and listen to a 5-minute presentation about the state’s current statistics related to rural mental health, and farming suicide rates over the last years. The survey was administered before the workshop session presented information and data to the participants. Georgia has four districts, and the agents were asked to attend the one workshop day in their district. The same workshop and speakers presented the information at all four of the workshop days. All of the workshops were held in the same week, as the presenters and researchers traveled to each of the districts.

Instrument

Questions within the survey addressed agents’ perceived comfort and perceptions of current levels of stress experienced by their community members. The current study was part of a larger project. The current study was focused on a specific scale to determine factors related to rural stress/farmer mental health. The instrument was developed from an instrument used to assess farmer mental health/stress in other regions of the country from a mental health and family well-being expert. The instrument used in the current study was reviewed by a panel of experts to ensure use of relevant terms for Georgia, layout of information, and applicability of topics to Georgia communities. Within the survey, an 8-item, Likert-type scale was used to quantify agent perceptions. The items within the scale were summed and averaged to create an indexed value. The scale was also shown to be a reliable (α = .90) (Field, 2009), with “1” indicating a “low” perception and “5” indicating a “high” perception.

Sample

Out of the 312 agents in Georgia, 281 responses were collected from agent participation at the workshops for a response rate of 90%. In the Northwest district, there were 79 participants, 63 participants in the Northeast district, 70 participants in the Southwest district, and 69 participants in the Southeast district. Some participants selected not to answer all the questions; however, since this was an exploratory survey for the state, all responses were kept and analyzed.

Results

Of the respondents, 133 (46.7%) classified themselves as Agricultural and Natural Resource agents, 97 (34.2%) classified themselves as 4-H agents, 40 classified themselves as Family and Consumer Sciences agents (14.1%), 8 (2.9%) classified themselves as other, and 6 (2.1%) chose not to respond.

Within the survey, agents were asked to assess the current level of stress/difficulty for farm and farm-related operations in their county. Overall, on a 5-point scale with “1” indicating “low” and “5” indicating “high”, agents perceived the current level of stress in their community to be slightly above “moderate” (M = 3.54, n = 271) (Table 1). Examining this question by district, the Northwest district had a mean of 3.32 (n = 75) or “moderate” and the Northeast district had a mean of 3.58 (n = 59). The Southwest district indicated the level of stress to be 3.74 (n = 68) and the Southeast district indicated a level of stress at 3.54 (n = 69).

Table 1
Level of Perceived Stress by District and Georgia
LocationNMSDMin.Max
Northwest753.321.031.05.0
Northeast593.58.722.05.0
Southwest683.74.922.05.0
Southeast693.54.961.05.0
Georgia2713.54.931.05.0

To further understand specific factors that may be associated with the current level of stress or difficulty for farms in their districts, agents were asked eight questions about specific elements in farming that may contribute to stress level (Table 2).

Table 2
Extension Agents' Perceptions of Factors Related to Rural/Farm Stress
 f%f%f%f%f%
concern for weather-related issues83.02710.17026.18832.87528.0
concern to make ends meet62.2259.36825.49736.27226.9
concern for cash-flow in the operation93.5186.99034.78633.25621.6
concern to get needed financing to continue93.4259.69536.48331.84918.8
concern for market and trade issues93.4238.89837.59034.54115.7
concern for crop/livestock prices114.2166.19436.010038.34015.3
concern for mental health/suicide risk249.16223.511142.05018.9176.4

Conclusions/Discussion/Recommendations

The survey provided a snapshot of Georgia Extension agents’ perceptions of their communities’ current need with regard to rural stress/farmer mental health. The data indicated most districts to be in similar positions with rural stress. Of an important note, the Southwest and Southeast districts did report more distressing levels of concern about rural stress. In utilizing these findings, it is important to note the timeline of the survey data collection. This survey data was collected within two weeks after Hurricane Michael caused great destruction to the agricultural industry in South Georgia. Therefore, these findings should be cautiously viewed with that external factor in mind. Additionally, specific factors that impact rural stress (weather issues, market prices, etc.) were similar throughout the state, with the Northwest district indicating a lower level of concern, while the Southeast and Southwest reported slightly higher levels of concern. While this data provides a baseline for Georgia Extension agents’ perceptions, the findings from this research cannot be applied to any other populations or locations; however, it can give a starting point for providing valuable resources to the communities.

Based upon the objectives for this research, the following recommendations were developed to assist in future work and research around rural stress/farmer mental health for Georgia. From an applied perspective, future discussions and trainings should be developed to help Georgia Extension agents identify resources for rural stress/mental health and how to effectively share that information with their community members. This coincides with previous research to recognize the unique needs and qualities of each community, specifically as they relate to existing cultures, which be accounted for when engaging them in mental health/stress efforts (Gregoire, 2002; Naik, 2017). Additionally, engaging other populations (farmers, community opinion leaders, faith-based leaders, etc.) to evaluate their perceptions of rural stress/mental health in the community may contribute to fully understanding the scope of stress/mental health in the community.

Future research should examine more in-depth Extension agents’ preparedness and comfort level in addressing rural stress/mental health in their communities. By collecting more in-depth demographic information, more specific conclusions about unique qualities, characteristics, and experiences that better position Extension agents to address rural stress/mental health in their communities could be developed. This could lead to creating more specialized training and resources targeted toward specific community and agent needs and mentorship programs. Additionally, future research should work with community members to identify the most appropriate form of communicating information about rural stress/mental health with specific audiences. The current research indicates a one-size-fits-all approach may not be beneficial for all areas, even in the same state.

The reality of suicide rates, even if only focused on the U.S. in this research context, warrants the need to consider this issue in other countries, specifically as it relates to U.S.-based researchers and specialists immersing themselves into local issues and cultural dynamics.

References

Centers for Disease Control and Prevention. (2019, January 28a). https://www.cdc.gov/ruralhealth/about.html

Centers for Disease Control and Prevention. (2019, January 28b). Drug overdose in rural America. https://www.cdc.gov/ruralhealth/drug-overdose/index.html

Centers for Disease Control and Prevention. (2019, January 28c). Leading causes of death in rural America. https://www.cdc.gov/ruralhealth/cause-of-death.html

Centers for Disease Control and Prevention. (2019, January 28d). Suicide in rural America. https://www.cdc.gov/ruralhealth/Suicide.html

America’s Health Rankings. (2019). Georgia Annual Report. Retrieved from https://www.americashealthrankings.org/explore/annual/measure/Suicide/

Anderson, B. T., Johnson, G. J., Wheat, J. R., Wofford, A. S., Wiggins, O. S., & Downey, L. H. (2012). Farmers’ concerns: A qualitative assessment to plan rural medical education. The Journal of Rural Health, 28(2), 115-121. https://doi.org/10.1111/j.1748-0361.2011.00366.x

Berry, H. L., Hogan, A., Owen, J., Rickwood, D., & Frager, L. (2011). Climate change and farmers’ mental health: Risks and responses. Asia-Pacific Journal of Public Health, 23(2), 1195-1325. https://doi.org/10.1177/1010539510392556

Brew, B., Inder, K., Allen, J., Thomas, M., & Kelly, B. (2016).  The health and wellbeing of Australian farmers: a longitudinal cohort study. Public Health, 16(988). https://doi.org/10.1186/s12889-016-3664-y

Clay, R. A. (2014). Reducing rural suicide. American Psychological Association, 45(4), 36. Retrieved from https://www.apa.org/monitor/2014/04/rural-suicide

El-Amin, T., Anderson, B. L., Leider, J. P., Sartorius, J., & Knudson, A. (2018). Enhancing mental health literacy in rural America: Growth of mental health first aid program in rural communities in the United States from 2008-2016.  Journal of Rural Mental Health, 42(1), 20-31. http://dx.doi.org.proxy-remote.galib.uga.edu/10.1037/rmh0000088 

Field, A. (2009). Discovering statistics using SPSS. SAGE Publications Inc.

Fitch, D., Donato, L., & Strawder, P. (2013). Extending the University into the community to address healthcare disparities. West Virginia Medical Journal, 109(4), 72-75. Retrieved from http://link.galegroup.com/apps/doc/A339117972/AONE?u=uga&side=AONE&xid=f9e3c273

Franz, N. K., & Townson, L. (2008). The nature of complex organizations: The case of Cooperative Extension. New Directions for Evaluation, 2008(120), 5–14. https://doi.org/10.1002/ev.272

Fraser, C. E., Judd, S. F., Humphreys, J. S., Frager, L. J., & Henderson, A. (2005). Farming and mental health problems and mental illness.  International Journal of Social Psychiatry, 51(4), 340-349. https://doi.org/10.1177/0020764005060844

Guin, S. M., Wheat, J. R., Allinder, R. S., Fanucchi, G. J., Wiggins, O. S. & Johnson, G. J. (2012) Participatory research and service-learning among farmers, health professional students, and experts: An agromedicine approach to farm safety and health.  Journal of Agromedicine, 17(1), 22-29. https://doi.org/10.1080/1059924X.2012.627319

Hanigan, I. C., Schirmer, J., & Niyonsenga, T. (2018). Drought and distress in Southeastern Australia. EcoHealth, (15)3, 642-655. https://doi.org/10.1007/s10393-018-1339-0

Hasbrouck, M. A., & Waddimba, A. C. (2017).  The work-related stressors and coping strategies of group-employed rural health care practitioners: A qualitative study. American Journal of Industrial Medicine, 60, 867-878. https://doi.org/10.1002/ajim.22753

Hossain, D., Gorman, D., Eley, R., & Coutts, J. (2010). Advisory and extension agents in supporting farmers in rural Queensland. Rural and Remote Health, 10(1593). Retrieved from http://apps.webofknowledge.com

Kane, S. P. (2019). 2019 Ag snapshots. Retrieved from https://www.caes.uga.edu/content/caes-subsite/caed/publications/ag-snapshots.html

Kilpatrick, S. Willis, K., Johns, S., & Peek, K. (2012).  Supporting farmer and fisher health and wellbeing in ‘difficult times’: Communities of place and industry associations.  Rural Society, 22(1), 31-44. https://doi.org/10.5172/rsj.2012.22.1.31

Kolstrup, C. L., Kallioniemi, M., Lundqvist, P., Kymäläinen, H. R., Stallones, L., & Brumby, S. (2013).  International perspectives on psychosocial working conditions, mental health, and stress of dairy farm operators. Journal of Agromedicine, 18(3), 244-255. https://doi.org/10.1080/1059924X.2013.796903

Lasley, P. (1986).  Farm crisis response: Extension and research activities in the North Central region. Retrieved from https://files.eric.ed.gov/fulltext/ED286706.pdf

Molgaard, V. K. (1997).  The extension service as key mechanism for research and services delivery for prevention of mental health disorders in rural areas.  American Journal of Community Psychology, 25(4), 515-544.  Retrieved from http://ejournals.ebsco.com.proxy-remote.galib.uga.edu/direct.asp?ArticleID=47C89F170F602768C3DF

Naik, A. (2017).  In search of farmer well-being.  International Journal of Agricultural Management, 6(1), 1-3. https://doi.org/10.5836/ijam/2017-06-01

Polain, J. D., Berry, H. L., & Hoskin, J. O. (2011). Rapid change, climate adversity and the next ‘big dry’: Older farmers’ mental health. The Australian Journal of Rural Health, 19, 239-243. https://doi.org/10.1111.j.1440-1584.2011.01219x

Ratcliffe, M., Burd, C., Holder, K., & Fields, A. (2016). Defining Rural at the U.S. Census Bureau. United States Census Bureau. Retrieved from https://www2.census.gov/geo/pdfs/reference/ua/Defining_Rural.pdf

Roy, P., Tremblay, G., & Robertson, S. (2014). Help-seeking among male farmers: Connecting masculinities and mental health. Socioligia Ruralis, 54(4), 460-476. https://doi:10.1111/sonu.12045

Rural Health Information Hub. (2019). Retrieved from https://www.ruralhealthinfo.org/states/Georgia

Thompson, E. L., & McCubbin, H. I. (1987).  Farm families in crisis: An overview of resources. Resource Review Essay, 36(4), 461-467. https://doi.org/10.2307/584501

University of Georgia Extension. (n.d.) Our Programs. Retrieved January 28, 2019, from http://extension.uga.edu/about/our-programs.html

Vanderbroom, C. P., & Madigan, E. A. (2007). Federal definitions of rurality and the impact on nursing research. Research in Nursing and Health, 30. 175-184. https://doi.org/10.1002/nur.20194b

Wang, V. L. (1974).  Using cooperative extension programs for health education.  American Journal of Public Health, 64(2), 107-111. https://doi.org/10.2105/ajph.64.2.107

Bats and Beyond: Communicating Wildlife and Climate Change Empathy to Youth through an Electronic Field Trip

Peyton N. Beattie, University of Florida, pbeattie@ufl.edu

Kevin W. Kent, University of Florida, kevin.kent@ufl.edu

Teresa E. Suits, University of Florida, teresasuits@ufl.edu

Jamie L. Loizzo, University of Florida, jloizzo@ufl.edu

J. C. Bunch, University of Florida, bunchj@ufl.edu

PDF Available

Abstract

Today’s youth must take decisive action to maintain and improve the world by being environmentally literate through understanding, interpreting, and applying information and media about the environment and human interactions. Ample room exists for science communicators and educators to work together to develop real-world programs for connecting youth audiences with scientists and science research to impact environmental perceptions, attitudes, and learning. Universities, Cooperative Extension, museums, and schools can use electronic field trips (EFTs) as a vehicle to connect youth audiences to scientists globally. Sixty-four classrooms in the United States and Trinidad and Tobago participated in an EFT at the University of Florida Bat Houses with three mammalogists from the Florida Museum of Natural History. The study examined students’ attitudes toward wildlife and climate change through pre/post-surveys, before and after participating in the EFT.

Introduction

Environmental communication leverages media with writing and imagery as a vehicle to educate, inform, and sometimes even persuade audiences about the environment and human relationships with the natural world. Today’s youth must take decisive action to maintain and improve the world by being environmentally literate through understanding, interpreting, and applying information and media about the environment and human interactions (Roth, 1992). Environmental literacy has an established history and is often defined as a combination of scientific knowledge, problem-solving, and critical thinking for fostering and growing positive environmental behaviors and attitudes (Cole, 2007; Roth, 1992). Increasing opportunities exist for environmental communicators and educators to develop innovative programs for addressing environmental engagement and literacy in youth audiences. The American Association for the Advancement of Science’s (AAAS; 2009) Project 2061 includes benchmarks such as The Living Environment and The Nature of Science with specific recommendations for introducing PK-12 youth to environmental concepts, as well as how scientists work to investigate problems and find solutions. The Next Generation Science Standards (NGSS; 2013) focus on cross-cutting concepts such as ecosystems, genetics, and global climate change. The National Research Council (NRC; 2000) suggested connecting PK-12 classrooms with the broader community to expand youth engagement and learning with a variety of concepts. Therefore, ample room exists for science communicators and educators to work together to develop real-world programs for connecting youth with scientists and science research to impact environmental perceptions, attitudes, and learning.

Literature Review

The following literature review including sub-sections about EFTs, wildlife empathy, and climate change attitudes informed the study design.

Electronic Field Trips (EFTs)

Communication and education programs can introduce youth to environmental science concepts, careers, and locations during a typical school day via online interactive technologies (Cassady et al., 2008; Garner, 2004; Tuthill & Klemm, 2002). Ideally, children should spend direct, in-person time outdoors for many physical and mental benefits, and learning about the world around them (Pate et al., 2011). While it is still highly recommended children directly engage with the environment for deep learning, in-person field trips are often not possible for schools. The cost and logistics to plan and implement traditional field trips have reduced the amount of time teachers can take students off school grounds to unique locations for studying the environment (Tuthill & Klemm, 2002). Instead, educators can leverage EFTs hosted from natural outdoor locations. EFTs can be streamed into classrooms to communicate and raise awareness about environmental issues, related STEM research, and careers (Loizzo et al., 2019).

EFTs (also sometimes referred to as virtual field trips) involve computer mediated-communication between a host location and a student site (Loizzo et al., 2019; Loizzo & Beattie, In Press). The programs can be offered in real-time (i.e., synchronous) via live, interactive web-streamed video or self-paced (i.e., asynchronous) via pre-recorded videos, websites, or virtual reality. Science communicators, educators, and scientists have developed and implemented various topics, formats, and technologies for EFTs. For instance, the Purdue zipTrips program included an EFT about animals, diseases, and genes for middle school students. The 45-minute zipTrips had an in-studio and off-site audience, live interactions with scientists, pre-recorded segments, and integrated activities. The EFTs positively impacted middle schoolers’ perceptions of scientists and their research (Adedokum et al., 2011a; Adedokun et al., 2011b). The EFT examined in this study, called Bats and Beyond, followed a live, interactive web-streamed video format from a university field site with scientists to youth in PK-12 classrooms throughout the United States and Trinidad and Tobago. The EFT included scientists presenting their wildlife and climate change research in real-time, as well as pre-recorded images and footage of bats and international research sites.

Wildlife Empathy

Youth empathy toward environmental issues and ecosystems via an introduction to animal models can be achieved through EFTs. Research has shown visitors to informal learning spaces such as zoos and aquariums often hold pre-existing, high empathy for wildlife (Young et al., 2018). Thus, there is a need to reach youth who may not necessarily have access to or typically visit settings to learn about animals. Young et al. (2018) defined empathy as, “…a stimulated emotional state that relies on the ability to perceive, understand and care about the experiences or perspectives of another person or animal” (p. 329). It is imperative that environmental communication and education programs depicting human-animal interactions keep empathy in mind, when developing key messages and images.

Kellert (1984) found the most frequent attitude type children hold toward animals is ‘humanistic’ – meaning they have strong affection toward animals, mostly pets. Prior research showed introducing youth to animals can positively impact their awareness, attitudes, and empathy toward bigger picture environmental issues such as endangered species and climate change (Morgan & Gramann, 1989). Morgan and Gramann (1989) found that when a wildlife expert demonstrated engagement with snakes, such as holding a snake for others to see and touch, people often became vicariously less fearful of the animals. Wagler and Wagler (2014) found educational activities which included live endangered spiders reduced children’s (i.e., ages 10-11) fear and disgust of spiders. Hence, animal models have the potential to influence attitudes toward animals and increase human concern for how changes in the environment are impacting animals.

Climate Change Attitudes

According to the Intergovernmental Panel on Climate Change (IPCC, 2014), the current warming trend beginning in the mid-20th Century can be attributed to human activity with a probability greater than 95%. Via the Cloud and Land Elevation Satellite (ICESat) and the NASA/German Aerospace Center Gravity Recovery and Climate Experiment (GRACE), NASA (2018) recorded a .12-inch increase in sea levels since 2012, with recorded ice losses of 241.4 billion tons per year in Antarctica. 

Children learn about climate change inside and outside of the classroom. Researchers have found that school-based interventions can increase climate change knowledge for children in Bangladesh (Kabir et al., 2015). The National Education Association (Flannery, 2017) advised teachers to use accurate data, local stories, cross-curricular connections, and inspiration for climate change education. Outside of the classroom, informal science learning centers (ISLCs) like zoos, museums, or libraries serve as a “safe” neutral space for visitors to learn about environmental issues and develop attitudes (Clayton et al., 2009). Humans have developed attitudes, perceptions, and beliefs about climate change. Affective (i.e., emotional), beliefs (i.e., values), cognitive (i.e., knowledge), and behavioral intentions are used to explain environmental attitudes (Christensen & Knezek, 2015). Research has shown young people form attitudes on climate change through their education and can be influenced by teacher figures. Middle school children in North Carolina reflected on their teacher’s beliefs that climate change is happening, but they formed their own opinions about climate change, which differed from their teacher’s (Stevenson et al., 2016). One study found science teachers’ teaching styles differed on climate change, based on their political ideologies (Plutzer & Lee, 2018).

Conceptual Frameworks

Social Cognitive Theory (SCT; Bandura, 2009) and the Theory of Planned Behavior (Ajzen, 1991) were conceptually used to guide this study.

Social Cognitive Theory

SCT guided this study to inform how the vicarious learning environment (Bandura, 2009) of an EFT impacted students’ attitudes toward wildlife and climate change. Additionally, the researchers examined how the participating teachers perceived the students’ attitudes toward wildlife and climate change within the vicarious learning program. The environment in which a person lives and the behaviors they see modeled is how their learning is constructed, rather than construction through individual autonomy (Bandura, 1999, 2009). Therefore, a person can witness an event and use “cognitive, vicarious, self-regulatory, and self-reflective” processes to determine how that event will shape their knowledge and behavior (Bandura, 2009, p. 95). Within this study’s EFT program context, researchers used a pre-/post-survey to investigate how the students used cognitive, vicarious, self-regulatory, and self-reflective processes to adjust their attitudes regarding wildlife and climate change.

The EFT developers intentionally designed and viewed Bats and Beyond as a vicarious learning experience. The EFT featured scientist role models, photos, and video content that could impact participants’ understanding of the specific content within the program, including bats, mammalogy and specimen curation, and climate change through a segment dedicated to each of these content areas. In turn, through vicariously viewing the role models and visual content, the EFT aimed to influence youths’ wildlife empathy and climate change attitudes.

Theory of Planned Behavior

The Theory of Planned Behavior (TPB; Ajzen, 1991) also conceptually served as a lens for researchers to understand students’ behavioral beliefs regarding wildlife empathy and climate change through their attitude changes before and after the EFT. TPB aimed to predict a person’s behavior based on their intentions and perceived behavioral control (Ajzen, 1991). Intent to perform an action is determined by a person’s internal will to want to complete such behavior. Still, that intent can also be limited by factors outside the person’s control, including money, time, or skills (Ajzen, 1991). Considering a person’s intrinsic motivation to perform an action coupled with a person’s actual ability to perform the behavior leads to actual control of the behavior (Ajzen, 1991). Ajzen (1991) noted, “perceived behavior control, together with behavioral intention, can be used directly to predict behavioral achievement” (p. 184).

The EFT developers and scientist role models intentionally included visual and audio content discussing human impacts on wildlife/bats and the environment. Specifically, developers and scientist role models aimed to use the example of how sea level rise and climate change has impacted bats’ habitats and migration patterns to impact youths’ understanding of climate change and intentions to participate in conservation behaviors for improving the environment.

Purpose and Research Questions

The purpose of the current study was to investigate how an environmentally-focused electronic field trip (EFT) program produced by agricultural communication, leadership, and education graduate students impacted participating youth’s wildlife empathy and attitudes toward climate change. Further, the investigation also sought to describe students’ attitudes toward climate change and wildlife empathy. More specially, the following research questions guided this research study:

  • What impact did participation in the EFT have on students’ attitudes toward wildlife?
  • What impact did participation in the EFT have on students’ attitudes toward climate change?
  • What were the teachers’ perceptions of the impact EFTs had on students’ attitudes toward wildlife and climate change? 

The study aligns with multiple topics outlined in the American Association of Agricultural Education (AAAE) Research Agenda. The EFT content and research focus on youth’s climate change and wildlife attitudes addressed complex problems occurring in the world, research priority area seven of the AAAE Research Agenda (Andenoro et al., 2016). Additionally, the study implemented new technologies, practices, and products to lead change in youth’s attitudes about wildlife and climate change, which is a focus of research priority area two of the agenda (Lindner et al., 2016).

Methods

EFT Context

Graduate students at the University of Florida developed, implemented, and assessed the Bats and Beyond EFT program, as part of the fourth author’s Information and Communication Technologies course. The eight graduate students enrolled in the course designed and delivered the EFT with the assistance of three scientists. The EFT was live and web-streamed at the bat houses on the University of Florida campus on November 15, 2018. Two sessions were offered at 2:00 p.m. and 4:00 p.m. EST. The EFT was titled Bats and Beyond to reflect the focus of the program’s content. Three segments were included in the live webcast: (a) an overview of bats, bat houses, and mammalogy careers; (b) an inside look at the university museum’s bat collections; and (c) the mammalogists’ bat genetics research conducted in The Bahamas. As such, three mammalogists from Florida Museum of Natural History volunteered to assist with the EFT. The graduate student course participants included seven master’s and doctoral students specializing in agricultural education, communication, leadership, and Extension and one agricultural and biological engineering doctoral student. 

The Institutional Review Board for Human Subjects Research at the University of Florida approved this study. Teachers were recruited to participate in the EFT through various outlets, including (a) direct email invitation to museum teacher contact lists and agriculture teachers in Florida, (b) word of mouth via students’ personal education contacts, (c) Streaming Science social media, and (d) direct email through Extension offices in Florida. Teachers registered for the EFT via the registration form and indicated their interest in participating in this research. Approved opt-out consent forms were sent home to parents to inform them of their child’s participation in the EFT and anonymous research. Parents who did not wish for the child to participate had the option to sign and return the forms to school. However, no parents opted for their child to not participate.

Study Design

Researchers conducted this study using a survey design approach. Researchers analyzed a sample (i.e., two schools – School A and School B) of the population (i.e., 64 schools participating in the EFT) to understand both tangibles (i.e., demographic data) and intangibles (i.e., student and teacher attitudes; Ary, Jacobs, Sorrensen, & Walker, 2014; Creswell & Creswell, 2018). The student and teacher surveys for this study were developed using Qualtrics, an online survey platform, and disseminated to the teachers who signed up to participate in the EFT via the Qualtrics link provided through email. Teachers distributed the pre- and post-surveys to the students. The population identified for this study was all schools (n = 64) who participated in the Bats and Beyond EFT. The sample for this specific study were the two schools who were classified as the intended audience for the EFT (i.e., middle and high schools) and were the two schools who completed all three surveys disseminated (i.e, the pre-survey, post-survey, and teacher survey). Thus, purposive sampling techniques were used to determine the sample for this study (Ary et al., 2014).

Participant Demographics

There were approximately 330 students from 64 elementary, middle, and high schools who participated in the live EFT webcasts. The two schools examined for this specific study were School A, and School B. School A is located on the eastern coast of central Florida. There were 738 students enrolled in School A in the 2018-2019 school year in grades 9-12 (Public School Review, n.d.). Seventy-five percent of students enrolled in School A were white, 10% of students were Hispanic, 7% of students classified themselves as two are more races, 6% of students were Asian, and 1% of students were black (GreatSchools.org, n.d.). The school-wide gender breakdown for School A was 50% female and 50% male (GreatSchools.org, n.d.). School B is located in north-central Florida. There were 948 students enrolled in School B for the 2018-2019 school year in grades 7-12 (Public School Review, n.d.). Seventy-four percent of students enrolled in School B were white, 13% of students were Hispanic, 10% were black, and 3% classified themselves as two or more races (GreatSchools.org, n.d.). Students’ gender breakdown at School B was 48% female and 52% male (GreatSchools.org, n.d.). For this study, researchers analyzed School A & B, grades 8-12. Specific demographic information regarding the student participant sample are outlined in Table 1. There was one teacher from School A and two teachers from School B for three teachers included in this study.

Table 1
Demographics of Student Participants

Instrumentation

Student Survey

Students participating in the EFT were asked to participate in pre- and post-surveys. The student survey measured students’ level of agreement or disagreement with 19 statements on a 7-point, Likert-type scale. Of the 19 total statements, 16 were analyzed to address the objectives of this study. Ten of the statements regarded wildlife empathy, and six statements regarded climate change. The remaining three statements were outside the scope of this study and were not analyzed. Some of the climate change statements used for this study were adapted from a climate change attitude instrument developed by Christensen and Knezek (2015). Individual item means and standard deviations are reported, thus reliability estimates were not computed because constructs were not developed. Validity is important to quantitative research to ensure the study is accurately measuring what was intended (Ary et al., 2014). Face and content validity of the instruments was determined by graduate students who were heavily involved in the production of the EFT. Face validity was determined by ensuring the questions on the instrument were relevant to the purpose and objectives of the EFT. 

Teacher Survey

Teachers of the participating EFT classrooms were invited to participate in a post-survey. Forty-four statements were included in the teacher survey for the teachers to rate their level of agreement or disagreement. Seven of the 44 statements were used in the analysis of this study because of their direct relation to the students’ attitudes toward wildlife and climate change. This study measured teachers’ level of agreement or disagreement using seven items on a 7-point, Likert-type scale. 

Data Analysis

All objectives of the study were analyzed using descriptive statistics. Individual mean scores and standard deviations were reported for each of the statements included in this study. The original values for the Likert scales were recoded to reflect a 1 to equal strongly disagree and a 7 to equal strongly agree, as the inverse scale was used in the survey. The values were re-coded to increase understanding of the results presented below. The following real limits of the scale were used to interpret the recoded mean scores and standard deviations: 1.00 – 1.49 = strongly disagree, 1.50 – 2.49 = disagree, 2.50 – 3.49 = somewhat disagree, 3.50 – 4.49 = neither agree nor disagree, 4.50 – 5.49 = somewhat agree, 5.50 – 6.49 = agree, 6.50 – 7.00 = strongly agree

Limitations

A limitation of the pre-survey and post-survey design used in this study is the duration between the pre and post-survey not being adequate time to demonstrate larger mean differences regarding students’ attitude change. The nature of this exploratory study and the small sample size does not allow for the results and conclusions of this study to be generalized to everyone who participated in the EFT but rather only explains what occurred in students’ attitudes and perceptions of the teachers from School A and School B.

Results

RQ1. What impact did participation in the EFT have on student’s attitudes towards wildlife?

Students’ highest mean score regarding their attitude toward wildlife for both the pre-survey (M = 5.05, SD = 1.39) and post-survey (M = 5.32, SD = 1.17) was it is important that scientists study bats (see Table 2). The more negative attitude, indicated by the lowest mean score, students reported for both the pre-survey (M = 3.27, SD = 1.54) and post-survey (M = 3.27, SD = 1.63) was related to bats are pests.

Table 2
Student Attitudes toward Wildlife Before and After the EFT
Note. Real limits of the scale: 1.00 – 1.49 = strongly disagree, 1.50 – 2.49 = disagree, 2.50 – 3.49 = somewhat disagree, 3.50 – 4.49 = neither agree nor disagree, 4.50 – 5.49 = somewhat agree, 5.50 – 6.49 = agree, 6.50 – 7.00 = strongly agree

RQ2. What impact did participation in the EFT have on student’s attitudes toward climate change?

The students reported a more positive attitude regarding the item bats are important to our environment for both the pre-survey (M = 5.39, SD = 1.59) and the post-survey (M = 5.58, SD = 1.17; see Table 3). A lower mean score regarding I believe human activity does not cause climate change was reported by the students for both the pre-survey (M = 3.30, SD = 1.81) and post-survey (M = 3.29, SD = 1.77).

Table 3
Student Attitudes toward Climate Change Before and After the EFT
Real limits of the scale: 1.00 – 1.49 = strongly disagree, 1.50 – 2.49 = disagree, 2.50 – 3.49 = somewhat disagree, 3.50 – 4.49 = neither agree nor disagree, 4.50 – 5.49 = somewhat agree, 5.50 – 6.49 = agree, 6.50 – 7.00 = strongly agree

RQ3. What did the teachers perceive the impact of participating in the EFT had on students’ attitudes? 

The teachers’ perceptions regarding the students’ attitudes was the most positive related to I encourage wildlife empathy in my class/program (M = 6.67, SD = .58; see Table 4). The lowest mean score reported by the teachers was regarding my students are concerned about bats (M = 4.33, SD = .58).

Table 4
Teacher Perceptions of Students' Attitudes toward Wildlife and Climate Change (n=3)
Real limits of the scale: 1.00 – 1.49 = strongly disagree, 1.50 – 2.49 = disagree, 2.50 – 3.49 = somewhat disagree, 3.50 – 4.49 = neither agree nor disagree, 4.50 – 5.49 = somewhat agree, 5.50 – 6.49 = agree, 6.50 – 7.00 = strongly agree

Conclusions and Discussion

Wildlife Attitudes

The students maintained a consistent attitude about wildlife before and after the EFT and indicated they somewhat agreed, neither agreed nor disagreed, or somewhat disagreed with nine of the ten statements regarding wildlife empathy. The students’ attitudes towards bats are pests were consistently the most negative and indicated they somewhat disagreed with the statement before and after the EFT. 

The participating students’ attitudes regarding the statement bats are cute moved in a negative direction according to the real limits of the scale between pre-survey and post-survey. The research team discussed this finding and attributed this negative direction in attitude to the pictures of bats and pinned bats exhibited throughout the EFT program. The EFT program exposed the students to what “real” bats look like, whereas students may have only had idealized images of bats in their minds before the EFT program. Some of the bat images the students viewed throughout the EFT are presented in Figure 1.

A picture containing indoor, photo, filled, window

Description automatically generated
Figure 1. A picture of a live, real bat taken by one of the participating mammalogists and a picture of a pinned bat collection taken by a graduate student shown to students throughout the EFT program.

Teachers somewhat agreed their students knew about bats before the EFT. However, the teachers neither agreed nor disagreed that their students were concerned about bats. The teachers strongly agreed wildlife empathy is encouraged in their class/program, and they discuss climate change concepts in their class/program. The students and teachers who participated in the Bats and Beyond EFT neither agreed nor disagreed the students were concerned about bats. Kellert (1984) discussed programs could not solely entertain with animals to have an impact. The findings from this study and Kellert’s (1984) statement indicates a need for children to have prolonged interactions with animals and the environment for deeper learning. Young et al. (2018) confirmed that empathy is a complicated construct, which takes time and multiple interactions to grow.

Climate Change Attitudes

The students’ attitudes toward climate change remained consistent before and after the EFT. The students’ attitudes toward the presented climate change statements ranged from somewhat disagree, neither agree nor disagree, or somewhat agree. The students had the most negative attitude regarding I believe human activity does not cause climate change and indicated they somewhat disagree before and after the EFT.  Teachers somewhat agreed their students are concerned about climate change, and the teachers indicated they discuss climate change in their class/program.

The results of the study indicated students who participated in the Bats and Beyond EFT from School A and School B agreed that bats are essential to the environment after the EFT. Similarly, the teachers who participated in the EFT from School A and School B perceived the EFT increased their students’ understanding of the role bats play in the ecosystem. Understanding the importance of an animal (i.e., bats) to the environment supports Thompson and Gullone’s (2003) research, which reported a positive and statistically significant relationship between humans and how they treat animals and, ultimately, the environment. Additionally, this finding aligns with Wagler and Wagler’s (2014) research that specified animal models positively influence attitudes towards animals and increase concern for how changes in the environment impact animals. The implementation of EFTs has repeatably shown positive impacts for youth audiences. EFTs are important to the agricultural communication field because of its unique position to engage with youth audiences in a dialogue around complex agricultural and natural resources issues rather than just developing content to be passively received by youth audiences. However, Streaming Science’s EFTs are in their infancy, and the team has established a number of recommendations for practice and research to ensure EFTs are continuously increasing impacts with youth audiences around agricultural and natural resources topics. 

Recommendations

Research

Future iterations of the EFT experience could better utilize the question and answer portions of the program to not only respond to questions from youth, but to also ask youth to respond to evaluation-type questions in real-time, such as (a) What do you think is the most important finding of this research?, (b) How do you feel about bats?, and  (c) What are some ideas you have for protecting the environment? In-depth analysis of supplemental materials teachers use in the classroom before and/or after the EFT could be conducted to understand the impact of supplemental materials on student learning outcomes. Researchers could also observe a classroom participating in the EFT and observe the same classroom not participating in the EFT to understand how teachers interact, discuss, and teach climate change and wildlife empathy, as compared to the scientists. There are opportunities to determine if EFTs impact other audiences besides youth (i.e., adults) and impactful with different types of content (i.e., developing complex solutions to complex problems rather than just engaging in dialogue around complex problems). Lastly, can an EFT be developed and hosted that has larger impacts on its audience than previously determined. More substantial impacts include concepts other than attitude, knowledge, and opinions and are geared more toward behavior change and developing complex solutions.

Practice

There is a potential for EFTs to raise awareness and support factual learning (Adedokun et al., 2011a; Adedokun et al., 2011b; Cassady et al., 2008; Stoddard, 2009). However, to impact student attitudes toward wildlife, science communicators and educators should provide supplemental materials or wrap-around experiences to prolong engagement with wildlife and reinforce learning and attitudes. This supplemental material and wrap-around experiences provide an opportunity for Streaming Science to expand their EFT programs by developing such materials or experiences for teachers to use with students. The additional materials should accompany the lessons to ensure that students are interacting with the material for wildlife empathy to be achieved (Young et al., 2018). Additionally, Streaming Science could develop an online community of practice for participating teachers to share content or lessons they have created and taught to add to teachers’ collections of resources. A community of practice for teachers participating in EFTs could open up a dialogue about STEM issues, communication and education strategies, build relationships, and answer questions regarding EFTs for implementation support and best practices.

References

Andenoro, A. C., Baker, M., Stedman, N. L. P., & Weeks, P. P. (2016). Research priority 7: Addressing complex problems. In T. G. Roberts, A. Harder, & M. T. Brashears (Eds.), American Association for Agricultural Education national research agenda: 2016-2020. Department of Agricultural Education and Communication. http://aaaeonline.org/resources/Documents/AAAE_National_Research_Agenda_2016-2020.pdf

Adedokun, O. A., Parker, L. C., Loizzo, J., Burgess, W. D., & Robinson, J. P. (2011a). Factors influencing participant perceptions of program impact: Lessons from a virtual fieldtrip for middle-school students. Journal of Extension, 49(6). https://www.joe.org/joe/2011december/a8.php

Adedokun, O., Parker, L. C., Loizzo, J., Burgess, W., & Robinson, J. P. (2011b). A field trip without buses: Connecting your students to scientists through a virtual visit. Science Scope, 34(9), 52-57. http://www.jstor.org/stable/43184161

Ajzen, I. (1991). The theory of planned behavior. Organizational Behavior and Human Decision Processes, 50, 179–211. https://doi.org/10.1922/CDH_2120VandenBroucke08

American Association for the Advancement of Science [AAAS]. (2009). Project 2061: Benchmarks for science literacy. http://www.project2061.org/publications/bsl/online/index.php

Ary, D., Jacobs, L. C., Sorensen, C., & Walker, D. A. (2014). Introduction to research in education (9th ed.). Wadsworth Cengage Learning.

Bandura, A. (1999). Social cognitive theory: An agentic perspective. Asian Journal of Social Psychology, 2, 21–41. https://doi.org/10.1111/1467-839X.00024

Bandura, A. (2009). Social cognitive theory of mass communication. In J. Bryant & M. B. Oliver (Eds.), Media effects: Advances in theory and research (3rd ed.). https://doi.org/10.4324/9780203877111

Cassady, J.C., Kozlowski, A. & Kornmann, M. (2008). Electronic field trips as interactive learning events: Promoting student learning at a distance. Journal of Interactive Learning Research, 19(3), 439-454.  https://www.learntechlib.org/primary/p/24187/

Clayton, S., Fraser, J., & Saunders, C. D. (2009). Zoo experiences: Conversations, connections, and concern for animals. Zoo Biology, 28, 377-397. https://doi.org/10.1002/zoo.20186

Christensen, R. & Knezek, G. (2015). The climate change attitude survey: Measuring middle school student beliefs and intentions to enact positive environmental change. International Journal of Environmental & Science Education, 10(5), 773-788. https://doi.org/ 0.12973/ijese.2015.276a

Cole, A.G. (2007). Expanding the field: Revisiting environmental education principles through multidisciplinary frameworks. Journal of Environmental Education, 38(2), 35-44. https://doi.org/ 0.3200/JOEE.38.1.35-46

Creswell, J. W., & Creswell, J. D. (2018). Research design: Qualitative, quantitative, and mixed methods approaches (5th ed.). Sage.

Flannery, M. E. (2017). 5 ways to teach about climate change in your classroom. News and Features from the National Education Association. http://neatoday.org/2017/03/14/teaching-about-climate-change/

Garner, L. C. (2004). Field trips and their effect on student achievement in and attitudes toward science: A comparison of a physical versus virtual field trip to the Indian River Lagoon [Doctoral dissertation, Florida Institute of Technology]. Proquest. https://search.proquest.com/docview/305101767?pq-origsite=gscholar&fromopenview=true

GreatSchools.org. (n.d.). Find a great school. https://www.greatschools.org

Intergovernmental Panel on Climate Change (IPCC). (2014). Climate change 2014 synthesis report summary for policymakers. Retrieved from https://www.ipcc.ch/site/assets/uploads/2018/02/AR5_SYR_FINAL_SPM.pdf

Kabir, M. I., Rahman, M. B., Smith, W., Lusha, M. A., & Milton, A. H. (2015). Child centered approach to climate change and health adaptation through schools in Bangladesh: A cluster randomized intervention trial. PLOS One, 10(8), https://doi.org/10.1371/journal.pone.0134993

Kellert, S. R. (1984). Attitudes toward animals: Age-related development among children. In M.W. Fox & L.D. Mickley (Eds.) Advances in animal welfare science. The Humane Society of the United States.

Lindner, J. R., Rodriguez, M. T., Strong, R., Jones, D., & Layfield, D. (2016). Research priority 2: New technologies, practices, and products adoption decisions. In T. G. Roberts, A. Harder, & M. T. Brashears (Eds.), American Association for Agricultural Education national research agenda: 2016-2020. Department of Agricultural Education and Communication. http://aaaeonline.org/resources/Documents/AAAE_National_Research_Agenda_2016-2020.pdf

Loizzo, J. L. & Beattie, P. N. (In Press). Self-study of a project-based graduate science communication course focused on electronic field trip development. North American College Teachers Association Journal.

Loizzo, J. L., Harner, M. J., Weitzenkamp, D. J., & Kent, K. (2019). Electronic field trips for science engagement: The Streaming Science Model. Journal of Applied Communications (103)4. https://doi.org/10.4148/1051-0834.2275

Morgan, J., & Gramann, J. (1989). Predicting effectiveness of wildlife education programs: A study of students’ attitudes and knowledge toward snakes. Wildlife Society Bulletin,17(4), 501-509. http://www.jstor.org/stable/3782720

National Research Council (NRC)(2000). How people learn: Brain, mind, experience, and school: Expanded edition. The National Academies Press. https://doi.org/10.17226/9853.

NGSS Lead States. (2013). Next generation science standards: For states, By states. The National Academies Press.

Pate, R. R., Mitchell, J. A., Byun, W., & Dowda, M. (2011). Sedentary behaviour in youth. British Journal of Sports Medicine, 45(11), 906-913. http://dx.doi.org/10.1136/bjsports-2011-090192

Plutzer, E., & Lee Hannah, A. (2018). Teaching climate change in middle schools and high schools: Investigating STEM education’s deficit model. Climatic Change, 149(3-4), 305-317. http://dx.doi.org/10.1007/s10584-018-2253-8

Public School Review. (n.d.). Welcome to public school review. Retrieved from https://www.publicschoolreview.com

Roth, C. (1992).  Environmental literacy: Its roots, evolution and directions in the 1990s. ERIC Clearinghouse for Science, Mathematics, and Environmental Education.

Stevenson, K. T., Peterson M. N., Bradshaw A. (2016). How climate change beliefs among U.S. teachers do and do not translate to students. PLOS One, 11(9). https://doi.org/10.1371/journal.pone.0161462

Stoddard, J. (2009). Toward a virtual field trip model for the social studies. Contemporary Issues in Technology and Teacher Education, 9(4), 412-438. https://www.learntechlib.org/p/28305/

Thompson, K. L. ., & Gullone, E. (2003). Promotion of empathy and prosocial behaviour in children through humane education. Australian Psychologist, 38(3), 175–182. https://doi-org.lp.hscl.ufl.edu/10.1080/00050060310001707187

Tuthill, G., & Klemm, E. B. (2002). Virtual field trips: Alternatives to actual field trips. International Journal of Instructional Media, 29(4), 453-468. https://www.questia.com/library/journal/1G1-97173049/virtual-field-trips-alternatives-to-actual-field

Wagler, A. & Wagler, R. (2014). Arthropods and the current great mass extinction: Effective themes to decrease arthropod fear and disgust and increase positive environmental beliefs in children? International Journal of Environmental and Science Education, 9, 197-214. https://doi.org/ 10.12973/ijese.2014.211a

Young, A., Khalil, K. A., & Wharton, J. (2018). Empathy for animals: A review of the existing literature. Curator, 61(2), 327–343. https://doi-org.lp.hscl.ufl.edu/10.1111/cura.12257

An Examination of Organizational Citizenship Behavior Characteristics Amongst Undergraduate Students

Kevan W. Lamm, University of Georgia, KL@uga.edu

Alyssa Powell, University of Georgia, anpowell@uga.edu

Alexa J. Lamm, University of Georgia, alamm@uga.edu

Eric D. Rubenstein, erubenstein@uga.edu

PDF Available

Abstract

In addition to creating engaging learning environments agricultural educators must also focus on preparing the next generation to enter the workforce. The purpose of this study was to examine a potential entry point for both responsibilities. Specifically, this study focused on the organizational citizenship behavior (OCB) characteristics of undergraduate students enrolled in an agricultural education leadership or communication course. Within the literature it is well established that OCBs are related to positive organizational outcomes such as: higher levels of performance and reduced turnover intention. However, there is little research establishing the general OCB characteristics of undergraduate students enrolled in agricultural education leadership or communication courses. Of the five OCB factors examined, students exhibited the highest levels of courtesy followed by altruism; students reported the lowest levels of conscientiousness. The results indicate that agricultural educators in leadership or communication courses may find courtesy as an effective entry point for engaging learners. Additionally, the use of OCBs as a content area may help to provide workforce development opportunities. Preparing individuals with both the technical knowledge required for a career and the skills required for success should be a priority of agricultural educators. The current study provides recommendations and proposes OCBs as a potential candidate for success skill education.

Introduction

For better or worse, companies are corporate machines which exist to make a profit (Hagel et al., 2009). Individuals are the input into these machines, and often, this workforce is sustained by the influx of university-educated post-graduates (Grubb & Lazerson, 2005). In today’s global economy, employees are often required to work in groups comprised of colleagues from different professional, ethnic, socio-economic, and personal backgrounds. Thus, the ability to be a good team player and work effectively with a variety of peers is a highly coveted skill (Clark, 2012). Managers are looking for high-capacity employees who can successfully collaborate with diverse personalities and maintain a network of connections (The Economist, 2018). The National Institute of Food and Agriculture (2015) reported a shortage of 22,500 college-educated employees for open positions within the agricultural industry. Therefore, the responsibility of adequately preparing all graduates entering the agricultural field becomes more critical such that new employees continue to be successful in the changing work environment. 

Education and human resource development typically occur in three locations within the agricultural sector: (1) formalized education (public schools and higher education), (2) workforce education through public and private organizations, and (3) nonformal education programs (Rivera & Alex, 2008). For academia specifically, how can higher education professionals ensure their students are equipped with skills necessary to be marketable in the current job market? One method is developing emotionally intelligent individuals who cultivate an atmosphere of psychological safety. A social confidence characterized by interpersonal trust and mutual respect between team members (Schneider, 2017; Duhigg, 2016), psychological safety is built by behaviors necessary to establish interpersonal bonds, e.g. conversational turn-taking and emotional conversations (Duhigg, 2016). Podsakoff et al. (1990) found the effects of transformational leadership behaviors were mediated by the follower’s trust, implying that even leader behaviors are filtered through follower perceptions. Individuals who feel valued and secure when participating in team discussions are more likely to embrace their full potential and provide the team with innovative ideas and creative solutions (Henderson, 2017). Encouraging students to appreciate the strengths of their peers creates pathways for open communication and may result in the development of individuals who become highly-effective members of high-performing corporate teams (Steenbarger, 2018).

Much research has been conducted regarding the desired traits of students entering careers. To be successful in new agricultural careers, students must obtain skill development in leadership, teamwork, critical thinking, creative problem solving, and adaptability (e.g. Casner-Lotto & Barrington, 2006; Landrum et al., 2010; Paranto & Kelkar, 2000; Rateau et al., 2015). Over time these habits will holistically improve performance and may lead to increased productivity and member satisfaction in the workplace (Steenbarger, 2018). Organ (1988) defined these behaviors as organizational citizenship behaviors (OCBs), i.e. discretionary behaviors “not part of the employee’s formal role requirements, [but which] promote the effective functioning of the organization,” (p. 4). Example behaviors include cooperating with coworkers, taking preventative actions against workplace issues, offering suggestions to improve the organization, and making intentional investments in one’s professional development skillset (Brief & Motowidlo, 1986). Therefore, it may be appropriate for agricultural educators to consider the role of these OCBs as both an effective classroom engagement technique and a toolset to prepare learners for the workforce.

A comprehensive review of existing citizenship behavior literature found strong evidence indicating OCBs are related to performance (Podsakoff et al., 2000). This belief is well-founded since OCBs may help to increase employee and managerial productivity, expand resource availability, improve coordination within and across work groups, improve an organization’s retention rate, and boost an organization’s overall adaptability (Podsakoff et al., 2000). In addition, OCBs have been found to relate to quantity and quality of work performance (Podsakoff et al., 1997; Podsakoff & MacKenzie, 1994; Walz & Niehoff, 1996). However, not all characteristics of OCBs impact performance in the same way; some dimensions display stronger evidence for these relationships than others (Podsakoff et al., 2000).

The current study is intended to contribute to meaningful and engaged learning within agricultural education contexts as well as adequately preparing students to engage in the scientific and professional workforce. By examining undergraduate student levels of the five OCB dimensions the study intends to address specific questions such as “what methods, models, and programs are effective in preparing people to work in a global agriculture and natural resource workforce?” (Roberts et al., 2016, p. 31) and “how can delivery of educational programs in agriculture continually evolve to meet the needs and interests of students?” (p. 39). Agricultural educators are at the nexus between engaged learning and workforce preparation. Awareness of learner tendencies may help to inform teaching strategies and learner outcomes (McKeachie & Svinicki, 2013).

Conceptual Framework

Although there are numerous conceptualizations of OCB (e.g. Smith et al., 1983; Moorman & Blakely, 1995; Podsakoff, et al., 2000), the conceptual framework for this research is based on the model proposed by Podsakoff et al. (1990), who identified five dimensions of OCB: altruism, conscientiousness, sportsmanship, courtesy, and civic virtue.

OCB Dimensions

Altruism

Although altruism is a facet of agreeableness in the five-factor personality model (Costa & McCrae, 1992), altruism – as a dimension of OCB – is defined as discretionary behaviors which help a specific individual with an organizationally relevant task or problem, (Podsakoff, et al., 1990). This behavior should not be perceived as mere charity nor precipitated by personality-based dispositions that predispose individuals towards helping others (Khalil, 2004). In this context, altruism is a voluntary willingness to assist a colleague with a work-related task (Podsakoff & MacKenzie, 1994).

Conscientiousness

It is important to note that while conscientiousness is one of the factors in the widely-accepted five-factor personality model (Costa & McCrae, 1992), this is not the context meant when referring to conscientiousness relative to OCB. As a dimension of OCB, conscientiousness characterizes the practice of voluntarily completing task-related behaviors at a level “well beyond the minimum role requirements,” (Podsakoff et al., 1990, p.115). This dimension is difficult to distinguish from in-role behavior because the distinction lies primarily in the degree to which the task is performed, not necessarily the nature of the task itself (Organ, 1988).

Sportsmanship

Sportsmanship consists of an individual’s willingness to assist others or tolerate less than ideal circumstances without complaint or perceived offense (Podsakoff et al., 1997; Podsakoff et al., 1990; Podsakoff & MacKenzie, 1994). This behavior involves the ability to maintain a positive demeanor, a state of general agreeableness, and a willingness to sacrifice personal interests for the good of the group (Podsakoff et al., 2000).

Courtesy

Courtesy is defined as a voluntary action that seeks to prevent the occurrence of work-related problems with other peers (Podsakoff et al., 1990; Podsakoff & MacKenzie, 1994). Examples of these behaviors include notifying superior of an absence or holding a meeting with team members to assign task-related responsibilities. Within the workplace, courtesy had a significant positive relationship with the quality of supervisory/subordinate relationships (Tanksy, 1993).

Civic Virtue

Civic virtue describes behaviors that exhibit concern for the organization and includes the individual’s responsibility to participate in the larger group (Podsakoff et al., 1990; Podsakoff & MacKenzie, 1994; Podsakoff et al., 1997). For example, these actions may involve offering constructive criticism to elevate work-group effectiveness, which may result in increased resource availability or enhanced efficacy (Podsakoff, et al., 1997).

OCBs in Education

Within the existing literature base, there is a noticeable dearth of studies examining OCB levels among undergraduate students in higher education. Many of the studies concerning OCBs in education examine antecedents of instructor-level OCBs (e.g. Somech & Ron, 2007; Kagaari & Munene, 2007) or the influence of instructor-level OCBs on various outcomes, (e.g. Khalid et al., 2010; Allison et al., 2001; Rose, 2012; Jimmieson et al., 2010).

As it relates to antecedents of instructor-level OCBs, previous research has found enabling school structures and academic optimism both had a positive relationship with instructor OCB levels (Messick, 2012). Kagaari and Munene (2007) found that lecturer overall OCB level was statistically significantly related to individual’s ability to plan, organize, and supervise others. Additionally, perceived superior support and collectivism both had positive relationships with altruism, conscientiousness, sportsmanship, civic virtue, and overall instructor-OCB levels, while negative affectivity had a negative relationship with these same instructor OCB dimensions (Somech & Ron, 2007).

Examining the effects of professor OCB levels on their undergraduate students’ success, Khalid et al. (2010) found both instructor-level altruism and courtesy positively predicted student academic performance. Jimmieson et al. (2010) found that teacher levels of civic virtue were positively related to job efficacy which in turn had a positive effect on student quality of school life.  Additionally, Rose (2012) found that faculty reporting higher OCB-I levels (i.e. altruism or interpersonal helping behaviors) reported higher student contact hours and those reporting higher levels of OCB-O (i.e. helping behaviors directed toward overall organization) reported a greater number of presentations and increased service on institutional committees.

At the student level, Allison et al. (2001) examined student academic performance based on: student productivity, as measured by student’s semester course load and associated semester GPA, and overall GPA. Results indicated that student sportsmanship and conscientiousness were positively related with student GPA. Additionally, sportsmanship, conscientiousness, civic virtue as well as overall OCB levels were positively related to student productivity (Allison et al., 2001). At the more general level, LeBlanc (2014) examined possible antecedents of OCBs in college students. Results indicated gender was positively related to a willingness to engage in or actual engagement in OCBs, and female students were more likely to report higher OCB levels. Additionally, religious affiliation had a positive relationship with student OCB levels, as students who identified as devout members of religious faiths reported higher levels of OCBs. Undergraduate major also had a statistically significant relationship with engagement in, or willingness to engage in OCBs, with students who majored in social sciences (i.e. helping professions) reporting higher levels of OCBs than students majoring in business or STEM related fields (LeBlanc, 2014). However, LeBlanc (2014) clarifies that this association may not be due to the specific major of students but rather the characteristics inherent in students who choose those particular majors. The present study extends upon the results of LeBlanc (2014) with a particular focus on level of OCB amongst undergraduate students enrolled in agricultural education leadership or communication courses.

Purpose and Research Objectives

The purpose of this study is to examine the five dimensions of OCB amongst undergraduate students enrolled in agricultural education leadership or communication courses. As such, this study is driven by the following research objectives:

  1. Describe individual levels of altruism amongst undergraduate students enrolled in agricultural education leadership or communication courses.
  2. Describe individual levels of conscientiousness amongst undergraduate students enrolled in agricultural education leadership or communication courses.
  3. Describe individual levels of sportsmanship amongst undergraduate students enrolled in agricultural education leadership or communication courses.
  4. Describe individual levels of courtesy amongst undergraduate students enrolled in agricultural education leadership or communication courses.
  5. Describe individual levels of civic virtue amongst undergraduate students enrolled in agricultural education leadership or communication courses.
  6. Examine whether OCB levels were statistically significantly different between classes.

Methods

A descriptive study was employed to meet these research objectives. Undergraduate students enrolled in agricultural education leadership or communication courses was the population of interest for the study. A purposive sample of five courses were selected across two universities, and included both agricultural leadership and agricultural communication courses. Specifically, four courses were from an agricultural leadership course taught over four semesters at the University of Florida from 2013 (n = 32), 2014 (n = 44), spring 2015 (n = 40), and fall 2015 (n = 39). The other class was from an agricultural communications course taught over one semester at University of Georgia in 2018 (n = 81). The agricultural leadership course was taught by the same instructor all four times and was focused on leadership in groups and teams. The course included lecture, service learning, and team projects. Enrollment was open to students across the university and included both agricultural majors, as well as individuals from other colleges across the university. The agricultural communication course was taught by a different instructor and included lecture and project-based learning. Again, enrollment was open to students across the university and included both agricultural majors, as well as individuals from other colleges at the university. It is important to note that the data analyzed within this study capitalizes on data previously collected within the Lamm et al. (2017) sample. The current study broadens the results of the previous one in several notable ways. While the previous study centered on personality analysis, this study concentrates on examining organizational citizenship behavior trends across undergraduate students enrolled in agricultural education leadership and communication courses. These disclosures are made based on existing recommendations for clarity (Kirkman & Chen, 2011).

Data were collected using a paper-based questionnaire, which was distributed, completed, and recollected for analysis during a single class period. A total of 236 responses were obtained for an effective response rate of 100%; however, incomplete responses contributed to lower response rates reported at the individual scale level.

Demographics were self-reported by each respondent. Of the respondents, 68.2%

(n = 161) were female, and 30.1% (n = 71) were male. Regarding university classification, 13.1% (n = 31) of respondents were freshmen, 14.4% (n = 34) were sophomores, 30.1% (n = 71) were juniors, and 41.9% (n = 99) were seniors. As for racial demographics, 84.3% (n = 199) of respondents indicated they were white, 8.1% (n = 19) indicated they were Black or African American, 7.2% (n = 17) indicated they were Asian or Pacific Islander, 0.4% (n = 1) indicated they were American Indian or Alaska Native. Individuals were able to select as many race categories as they felt applied, therefore total counts may not match overall response rate. Respondents indicated an age range between 18 and 48 (M = 21.34, SD = 3.03). Respondent major information was not collected as part of the research study; however, respondents represented agricultural undergraduate majors including agricultural education, animal sciences, and horticulture, as well as other majors within the university including, business, journalism, engineering, family and consumer sciences, and so forth.

Individual-level OCB scores for each dimension were collected using the 24-point scale developed by Podsakoff et al. (1990).  Responses were rated on a five-point, Likert-type scale, with possible response ranging from 1 = strongly disagree to 5 = strongly agree. Five scale items measured conscientiousness, including “I obey company rules and regulations even when no one is watching.” Sportsmanship was measured with five scale items, for example, “I consume a lot of time complaining about trivial matters.” Four scale items measured civic virtue and included “I attend meetings that are not mandatory but are considered important.” Courtesy was measured by five scale items, for example, “I am mindful of how my behavior affects other people’s jobs.” Altruism was measured by five scale items, including “I willingly help others who have work-related problems.”

 As a measure of internal consistency and reliability, Cronbach’s α coefficient was calculated for each of the five dimension indices, as well as the overall OCB index. In particular, the altruism index was found to have a Cronbach’s α coefficient of 0.84, the conscientiousness index was found to have an α coefficient of 0.65, the sportsmanship index was found to have an α coefficient of 0.76, the courtesy index was found to have an α coefficient of 0.77, and the civic virtue index was found to have an α coefficient of 0.70. The overall instrument had an α coefficient of 0.85.

The data were analyzed using the Statistical Package for the Social Sciences (SPSS) version 25. Descriptive statistics were calculated to quantify levels of OCBs amongst undergraduate students enrolled in agricultural education leadership or communication courses. A one-way ANOVA was used to determine whether OCB observations were statistically significantly different between classes, or whether OCB values were not statistically significantly different. A significance level of .05 was determined a priori.

Results

Descriptive statistics, including mean scores, were calculated for the five individual OCB dimensions as well as an overall OCB index score. Results are presented in Table 1.

Table 1
OCB Scale Scores of Undergraduate Students Enrolled in Agricultural Education Leadership or Communication Courses
OCB Scale ScoresnMSDMinMax
Courtesy2354.230.462.805.00
Altruism2344.010.542.005.00
Overall2264.010.363.004.96
Sportsmanship2313.990.641.805.00
Civic Virtue2303.930.512.505.00
Conscientiousness2353.860.532.205.00

Undergraduate students enrolled in agricultural education leadership or communication courses reported the highest mean score in the courtesy dimension (M = 4.23, SD = 0.46) and the lowest mean score for the conscientiousness dimension (M = 3.86, SD = 0.53). The results of the one-way ANOVA tests found no significant effect of class on any of the five OCB dimensions nor overall OCB for undergraduate students completing agricultural education leadership or communication related courses. The results from the ANOVA analyses are displayed in Table 2.

Table 2
Summary of One-Way ANOVA Tests
  SSdfMSFp
AltruismBetween Groups0.36240.0900.3040.875
Within Groups68.2532290.298  
Total68.615233   
ConscientiousnessBetween Groups1.99740.4991.8090.128
Within Groups63.4722300.276  
Total65.470234   
SportsmanshipBetween Groups3.59740.8992.2400.066
Within Groups90.6982260.401  
Total94.295230   
CourtesyBetween Groups0.85440.2130.9810.418
Within Groups50.0182300.217  
Total50.871234   
Civic VirtueBetween Groups0.64640.1620.6270.644
Within Groups57.9912250.258  
Total58.637229   
Overall OCBBetween Groups0.85140.2131.6660.159
Within Groups28.2102210.128  
Total29.061225   

Conclusions, Recommendations, and Implications

The first five research objectives concerned describing the individual levels of each OCB dimension in undergraduate students enrolled in agricultural education leadership or communication courses. We found that within this sample, all of the OCB dimensions were rated relatively high. From their perspective, students primarily agreed that they displayed these OCB dimensions within their class.

The last research objective concerned examining potential OCB differences between classes. The lack of a statistically significant difference observed between classes was somewhat unexpected. For example, LeBlanc (2014) found that undergraduate student OCB levels were likely to be influenced by factors including gender, religious affiliation/devoutness, and most relevantly university major. Within the present study no statistically differences were observed between classes. Therefore, the result of the current study may indicate undergraduate OCB levels of students enrolled in agricultural education leadership or communication courses may be more consistent across course type and university than originally expected. This conclusion is more consistent with previous research amongst university instructors where a range of instructor competencies were not found to be statistically significantly related to OCBs (Kagaari & Munene, 2007).

A primary contribution of the present study is to establish a foundational set of data upon which to expand future agricultural education related research. However, as a main limitation, the scope of the study is limited and thus the generalizability is also limited. To mitigate the limitation, purposive selection of five courses across both agricultural education leadership and communication, from multiple years, with two different instructors, and in two different universities was conducted. Therefore, although the results indicate that there were not any statistically significant differences observed between classes, it is not possible to conclude that the primary observations (e.g. courtesy is highest and conscientiousness is lowest) will remain consistent across all agricultural education leadership and communication courses. An associated recommendation would be for educators to consider administering an instrument like the one from the present study at the beginning of a course to get a general sense for the composition of learners and what teaching strategies might appeal to learners within a specific classroom environment. An additional recommendation would be to replicate the findings of the present study and determine whether there are trends that agricultural educators can use to inform their teaching practice. For example, replicating data collection in agricultural education courses across leadership, communication, teacher preparation, extension, and so forth may help to validate the present findings, or provide a more comprehensive perspective of learner tendencies, doing so would help educators continue to create learning environments that “continually evolve to meet the needs and interests of students” (Roberts et al., 2016, p. 39).

A recommendation for future research would be to examine OCBs as a set of predictor variables for student performance. Specifically, are students going to be more successful in the classroom and in their careers because they display higher OCB levels? Or do students who display higher OCB levels do so because of their success? This distinction has not yet been explored within the literature so it would be interesting to examine the influence of mediating variable, such as conditions which predispose OCBs, on external outcomes. Another recommendation for future research would be to examine whether instructor-level OCBs influence student-level OCBs at the undergraduate level. For instance, if a professor displays high levels of courtesy, or any other OCB dimension, would students be more inclined to reciprocate these behaviors? Support for this line of research doesn’t necessarily result from the conclusions of this study, but the concepts are related and are important to consider within the context of agricultural education more broadly. For example, Khalid et al. (2010) found that instructor-level OCBs positively influence student performance, while Allison et al. (2001) found that student-level OCBs positively influence student performance in terms of productivity and overall GPA. We wonder, is there an interaction between these two relationships? Is it because instructor displays of OCBs appeal to, and catalyze the reciprocal display of, student OCBs, which in turn contribute to increased performance? The literature appears to be inconclusive so it is important to continue to examine the nature of the phenomenon.

In addition to the above recommendations for research, recommendations are also posited for application. Specifically, a recommendation would be for agricultural leadership and communication educators to consider integrating OCB education curriculum into existing course content. The National Council for Agricultural Education (2015) outlined career ready practices amenable to OCB education as part of their Agriculture, Food, and Natural Resources foundational content standards. Specifically, CRP.09.03 states educators should “demonstrate behaviors that contribute to a positive morale and culture in the workplace and community (e.g., positively influencing others, effectively communicating, etc.” (National Council for Agricultural Education, 2015, p. 22). Sub-sections of this section instruct agricultural educators to identify and summarize respectful and purposeful behaviors, to examine personal levels of these behaviors, and to devise, implement, and evaluate strategies for continuation and improvement of these behaviors (National Council for Agricultural Education, 2015). These standards represent clear opportunities for integration of OCB education into the existing AFNR content. We recommend that teachers capitalize on these opportunities by introducing OCB education to students and discussing the characteristics and implications of OCBs in community and career settings.

Beyond the use of OCBs to connect with learners as an engagement strategy, the literature is clear that OCBs can have a positive effect once an individual enters the workforce (e.g., Alkahtani, 2015; Chen et al., 1998; Podsakoff et al., 1997). Taking the time to inform learners about the fundamental characteristics of OCBs and the relationship with many positive workforce outcomes may help individuals to be aware of how their actions and specifically their embodiment of OCB characteristics may help “to prepar[e] people to work in a global agriculture and natural resource workforce” (Roberts et al., 2016, p. 31). The use of OCBs as a content area within educational settings may help to provide workforce development opportunities. Preparing individuals with not only the technical knowledge required for a career, but also for the skills required for success in the workforce should be a priority of agricultural educators. The current study provides recommendations and proposes OCBs as a potential candidate for success skill education.

References

Alkahtani, A. (2015). Organizational citizenship behavior (OCB) and rewards. International Business Research, 8(4). 210-222. https://doi.org/10.5539/ibr.v8n4p210

Allison, B. J., Voss, R. S., & Dryer, S. (2001). Student classroom and career success: The role of organizational citizenship behavior. Journal of Education for Business, 76(5). 282-288. https://doi.org/10.1080/08832320109599650

Brief, A. P., & Motowidlo, S. J., (1986). Prosocial organizational behaviors. Academy of Management Review, 11(4). 710-725. https://doi.org/10.5465/amr.1986.4283909

Casner-Lotto, J., & Barrington, L. (2006). Are they really ready to work? Employers’ perspectives on the basic knowledge and applied skills of new entrants to the 21st Century U.S. workforce. USA: The Conference Board, Inc., the Partnership for 21st Skills, Corporate Voices for Working Families, and the Society for Human Resource Management.

Chen, X. P., Hui, C., & Sego, D. J. (1998). The role of organizational citizenship behavior in turnover: Conceptualization and preliminary tests of key hypotheses. Journal of Applied Psychology, 83(6). 922-931. https://doi.org/10.1037/0021-9010.83.6.922

Clark, D. (2012). Five ways to become a better team player. Forbes. Retrieved from https://www.forbes.com/sites/dorieclark/2012/03/28/five-ways-to-become-a-better-team-player/#3a114590659c

Costa, P. T., Jr., & McCrae, R. R. (1992). Revised NEO personality inventory and five factor inventory professional manual. Psychological Assessment Resources.

Duhigg, C. (2016). What Google learned from its quest to build the perfect team. New York Times. Retrieved from https://www.nytimes.com/2016/02/28/magazine/what-google-learned-from-its-quest-to-build-the-perfect-team.html

Grubb, W. N., & Lazerson, M. (2005). Vocationalism in higher education: The triumph of the education gospel. The Journal of Higher Education, 76(1), 1-25. https://doi.org/10.1080/00221546.2005.11772273

Henderson, T. (2017). Leadership and teamwork: The secret sauce to business success. Forbes. Retrieved from https://www.forbes.com/sites/forbescoachescouncil/2017/02/08/leadership-and-teamwork-the-secret-sauce-to-business-success/#4500fb1136f1

Jimmieson, N. L., Hannam, R. L., & Yeo, G. B. (2010). Teacher organizational citizenship behaviours and job efficacy: Implications for student quality of school life. British Journal of Psychology, 101(3), 453-479. https://doi.org/10.1348/000712609×470572

Kagaari, J. R. K., & Munene, J. C. (2007). Journal of European Industrial Training, 31(9), 706-726. https://doi.org/10.1108/03090590710846675

Khalid, S. A., Jusoff, H. K., Othman, M., Ismail, M., & Rahman, N. A. (2010). Organizational citizenship behavior as a predictor of student academic achievement. International Journal of Economics and Finance, 2(1). 65-71. https://doi.org/10.5539/ijef.v2n1p65

Khalil, E. (2004). What is altruism? Journal of Economic Psychology, 25. 97-123. https://doi.org/10.1016/S0167-4870(03)00075-8

Kirkman, B. L., & Chen, G. (2011). Maximizing your data or data slicing: Recommendations for managing multiple submissions from the same data set. Management and Organization Review, 7(3). 433-446. https://doi.org/10.1111/j.1740-8784.2011.00228.x

Lamm, K. W., Sheikh, E., Carter, H. S., & Lamm, A. J. (2017). Predicting undergraduate leadership student goal orientation using personality traits. Journal of Leadership Education, 16(1), 18-33. https://doi.org/10.12806/V16/I1/R2

Landrum, R. E., Hettich, P. I., & Wilner, A. (2010). Alumni perceptions of workforce readiness. Teaching of Psychology, 37(2), 97-106. https://doi.org/10.1080/00986281003626912

LeBlanc, C. J. (2014). Characteristics shaping college student organizational citizenship behavior. American Journal of Business Education, 7(2), 99-108.

McKeachie, W., & Svinicki, M. (2013). McKeachie’s teaching tips. Cengage Learning.

Messick, P. P. (2012). Examining relationships among enabling school structures, academic optimism, and organizational citizenship behaviors [Doctoral dissertation, Auburn University]. Auburn University Electronic Theses and Dissertations. http://etd.auburn.edu/handle/10415/3098

Moorman, R. H., & Blakely, G. L. (1995). Individualism-collectivism as an individual difference predictor of organizational citizenship behavior. Journal of Organizational Behavior, 16. 127-142. https://doi.org/10.1002/job.4030160204

National Council for Agricultural Education. (2015). Agriculture, food, and natural resources (AFNR) career cluster content standards. Retrieved from https://thecouncil.ffa.org/afnr/

National Institute of Food and Agriculture (2015). One of the best fields for new college graduates? Agriculture. Retrieved from https://nifa.usda.gov/press-release/one-best-fields-new-college-graduates-agriculture

Organ, D. W. (1988) Organizational citizenship behavior: The good soldier syndrome. Lexington, Books.

Paranto, S. R., & Kelkar, M. (2000). Employer satisfaction with job skills of business college graduates and its impact on hiring behavior. Journal of Marketing for Higher Education, 9(3), 73-89. https://doi.org/10.1300/J050v09n03_06

Podsakoff, P. M., Ahearne, M, & MacKenzie, S. B. (1997). Organizational citizenship behavior and the quantity and quality of work group performance. Journal of Applied Psychology, 82(2), 262-270. https://doi.org/10.1037/0021-9010.82.2.262

Podsakoff, P. M., & MacKenzie, S. B. (1994). Organizational citizenship behaviors and sales unit effectiveness. Journal of Marketing Research, 31(3). 351-363. https://doi.org/10.1177/002224379403100303

Podsakoff, P. M., MacKenzie, S. B., Moorman, R. H., & Fetter, R. (1990). Transformational leader behaviors and their effects on followers’ trust in leader, satisfaction, and organizational citizenship behaviors. Leadership Quarterly, 1(2), 107-142. https://doi.org/10.1016/1048-9843(90)90009-7

Podsakoff, P. M., MacKenzie, S. B., Paine, J. B., & Bachrach, D. G. (2000). Organizational citizenship behaviors: A critical review of the theoretical and empirical literature and suggestions for future research. Journal of Management, 26(3). 513-563. https://doi.org/10.1177/014920630002600307

Rateau, R. J., Kaufman, E. K., & Cletzer, D. A. (2015). Innovative classroom strategies that prepare college graduates for workplace success. Journal of Agricultural Education, 56(3), 52-68. https://doi.org/10.5032/jae.2015.03052

Rivera, W. M., & Alex, G. E. (2008). Human resource development for modernizing the agricultural workforce. Human Resource Development Review, 7(4), 374-386. https://doi.org/10.1177/1534484308324633

Roberts, T. G., Harder, A., & Brashears, M. T. (Eds). (2016). American Association for Agricultural Education national research agenda: 2016-2020. Department of Agricultural Education and Communication.

Rose, K. J. (2012). Organizational citizenship behaviors in higher education: Examining the relationships between behaviors and performance outcomes for individuals and institutions (Publication No. 403) [Doctoral dissertation, University of Arkansas-Fayetteville]. ScholarWorks@UARK Theses and Dissertations. https://scholarworks.uark.edu/etd/403/

Schneider, M. (2017, July 19). Google spent 2 years studying 180 teams. The most successful ones shared these 5 traits. Inc. Retrieved from https://www.inc.com/michael-schneider/google-thought-they-knew-how-to-create-the-perfect.html

Smith, C. A., Organ, D. W., & Near, J. P. (1983). Organizational citizenship behavior: Its nature and antecedents. Journal of Applied Psychology, 68. 655-663. https://doi.org/10.1037/0021-9010.68.4.653

Somech, A., & Ron, I. (2007). Promoting organizational citizenship behavior in schools: The impact of individual and organizational characteristics. Educational Administration Quarterly, 43(1), 38-66. https://doi.org/10.1177%2F0013161X06291254

Steenbarger, B. (2018, June 29). The three strategies for making your team work. Forbes. Retrieved from https://www.forbes.com/sites/brettsteenbarger/2018/06/29/three-strategies-for-making-your-team-work/#6fd944074f88

Tansky, J. W. (1993). Justice and organizational citizenship behavior: What is the relationship? Employee Rights and Responsibilities Journal, 6(3). 195-207. https://doi.org/10.1007/BF01419444

The Economist. (2018, September 6). The pros and cons of collaboration. Retrieved from https://www.economist.com/business/2018/09/06/the-pros-and-cons-of-collaboration

Walz, S. M., & Niehoff, B. P. (1996). Organizational citizenship behaviors and their effect on organizational effectiveness in limited-menu restaurants. Academy of Management Best Papers Proceedings, 1996(1), 307-311. https://doi.org/10.5465/ambpp.1996.4980770