Scott A. Beck, Georgia Southern University, salbeck@georgiasouthern.edu
Yasar Bodur, Georgia Southern University, ybodur@georgiasouthern.edu
Abstract
Based upon quantitative survey data from 359 students, aged thirty or younger, at a large, state university that serves a relatively balanced rural / urban population, this manuscript outlines what Southern young people, particularly young educators, think they know and what they believe regarding the workers who are essential to their daily diet of fruits and vegetables: America’s immigrant and migrant farm workers. The participants’ attitudes are compared and contrasted with their relevant life experiences and backgrounds such as: gender, race / ethnicity, political affiliation, and agricultural experience. Using a factor analyses, significant clusters of semantically and statistically valid background experience subgroups and participant attitudes are extracted from the survey data. These explanatory factors are then cross-referenced to map out crucial and often surprising differences and similarities in the knowledge and attitudes of various sub-populations including: teachers, young people with farm work experience, and self- identified political groups.
Introduction and Theoretical Framework
For decades the U.S. Department of Labor’s National Agricultural Worker Survey has consistently documented that 70% of U.S. farm workers were born outside the U.S., mostly in Mexico (Carroll, Georges & Saltz, 2011). Current anti-immigrant politics notwithstanding, this is not likely to change soon. Despite the rise of agricultural technology, there are many things machines and robots still cannot do as fast, as efficiently, or as carefully as a human. Moreover, most native-born Americans are not willing to pluck tomatoes all day in the hot sun or chase chickens through a barn full of excrement for sub-poverty wages (Smith, 2010; Thompson, 2011; Case, 2013). Thus, for the foreseeable future, American farmers, ranchers, agribusiness people, grocers, and consumers will all continue to depend upon immigrants to provide them with the labor, crops, and produce that keep them in business and well-fed.
However, as Rothenberg (1998) writes: “Like so many consumer products, fruits and vegetables appear before us as if by magic . . . Few people realize that virtually every vegetable or piece of fruit we eat was handpicked by a farm worker, a member of our nation’s poorest and most disadvantaged class of laborers” (p. xiii). This is because our society erases the experience of migrant farm workers, as documented by analyses of cultural representations of farming, migrant farm workers, immigrants, and Latinos (Hoffman & Daniels, 1995; Barerra, Quiroa & West- Williams, 1999; Kruse, 2001; Lamme, Fu & Lowery, 2004; McGlinn 2004; Salinas & Fránquiz, 2004b; Jack, 2005; Nilsson 2005). As Beck (2009) states, for most Americans, “migrants are hidden behind heroic…, oversimplified, and culturally iconic white farmers such as Mr. Greenjeans, Farmer Wants a Wife, and Playskool’s suspender-wearing figurines” (p.100). Meanwhile, those of us who have worked in agriculture scoff at Paris Hilton’s The Simple Life and the lack of Latinos in Dodge’s God Made a Farmer commercial (Varela, 2013).
More disappointingly, despite the fact that the majority of U.S. farm labor is done by immigrant and/or migrant farm workers (Carroll, Georges & Saltz, 2011), this erasure and silence extend to agricultural education. A search for research regarding immigrant and migrant farm workers published since 2000 in significant U.S. agricultural education journals is nearly fruitless, with most references occurring only in passing (Hurst & Sperry, 2000; Kelsey, Weeks & Terry, 2002; Ortega et al., 2003; Rich et al., 2009). One exception is a 2006 NACTA Journal article by Mullinix et al. revealing a somewhat surprising desire among Latino farm workers for careers as agriculturalists. The only other examples are a handful of articles in the Journal of Extension regarding adult health/safety outreach efforts targeting migrants (Viramontez-Anguiano, 2001; Driscoll, 2003; Lobley & Peronto, 2007; Wallace, 2008; Baker & Chappelle, 2012).
This lack of acknowledgement of migrancy in agricultural education research is not surprising. The daily lives of migrant farm workers include harsh realities that many teachers, even agriculture educators, would rather avoid addressing: the dangers of immigration and the border; substandard housing; exhausting, unhealthy work conditions; children and child labor in fields and barns; continual movement and disrupted schooling; and the grievous inequity of the U.S. economy (Valle, 1994; Rothenberg, 1998; Beck, 2003; Martin, 2003; Beck, 2004; Salinas & Fránquiz, 2004a; Mantero, 2008; Owens, 2008; Thompson & Wiggins, 2009; Holmes, 2013)
However, given the absolute dependence of our agricultural system upon immigrant and migrant labor, today’s politics of nativistic policymaking, and the rapid growth of the rural South’s Latino population (Murphy, Blanchard & Hill, 2001; Murillo, 2002; Villenas, 2002; Fink, 2003; Smith & Furuseth, 2006; Odem & Lacy, 2009; Marrow, 2011), it is more important than ever for educators, especially agriculture educators in this region, to understand, confront, and counter the stereotypes regarding immigrants and migrant labor held by their colleagues and students.
Agriculture educators can build new understandings of migrancy within the community of teachers. With broader understandings, it is reasonable to expect teachers to have more positive attitudes about migrant children, attitudes that will lead to better academic outcomes for the students (Brophy & Good, 1974; Whittaker, Salend & Gutierrez, 1997; Walker, Shafer & Iiams, 2004; Gay, 2010). Agriculture educators also have direct influence upon tomorrow’s farmers: today’s agriculture education students. The voices of farmers who employ migrants can be very persuasive in helping mainstream Americans understand our dependence on migrancy. But they can only raise their voices if they are well-informed by their teachers, agriculture educators.
Purposes and Objectives
Agriculture educators cannot work toward these goals without a baseline assessment of what teachers and young people think and believe about immigrants and migrants. Thus, the purpose of this study is to map the attitudes of youth Southerners – educators and non-educators – regarding immigrant and migrant laborers in agriculture, to begin answering questions such as: What do young Southerners, including the next generation of teachers, think and believe about migrancy? What background experiences and demographic factors impact their beliefs and opinions? This study collected data regarding the participants’ backgrounds, experiences, knowledge, and attitudes and then used statistical methods to address the following objectives:
- Describe the participants’ demographics and identify background experience subgroups;
- Describe the participants’ attitudes regarding migrancy, farming, and immigration; identify the most and least controversial issues and those that educators view differently;
- Analyze the responses along a liberal-conservative spectrum and describe the participants’ political orientations regarding the issues at hand;
- Analyze participants’ responses for underlying attitude factors;
- Identify noteworthy correlations between participants’ demographics and experiential subgroups – and – their attitude response factors.
Participants, Methods and Procedures
The participants in this study were volunteers from the primary researcher’s college courses between 2011 and 2013. Many of these courses focused on language arts methods for teachers. However, participants were also drawn from his freshman seminars regarding farming, immigration, and migrancy. Of the approximately 465 potential participants, 410 gave permission for their data to be included in this study. Of these, 359 fell below the 30 year-old cut off for this manuscript’s focus upon young people.
At the beginning of each course, the primary researcher provided his students with both a verbal and written description of the study, explaining that their participation or non-participation would neither raise nor lower their grade – nor would it increase or decrease their workload for the course. Students chose whether their data would be included in the study and completed a two-part online survey. The first section included 19 questions documenting their personal demographics and background experiences (age; gender; ethnicity/race; travel; language ability; agricultural experience; family income, politics, and history of immigration/migration).
The second part of the survey focused upon participants’ attitudes regarding immigration and migrant farm worker issues. This part consisted of 51 prompts to which the students responded on a five-point Likert scale extending from “strongly agree” (1) to “strongly disagree” (5), with the middle (3) as “neither agree or disagree.” The statements were intentionally provocative and reflected opinions found at both ends of the political and rhetorical spectrum, for example: “People in the USA without documentation should be protected by our laws” versus “Our country needs to deport all the illegal aliens right away.” The repugnant term “illegal alien” was included in some prompts to accurately reflect the terms of the debate. Data collection began over a year before the Associated Press shifted its policy regarding the term (Haughney, 2013).
The prompts were screened by the second researcher, an immigrant to the U.S. with a strong background in multicultural issues and quantitative research, for content validity and accuracy in reflecting real-world opinions about these issues. For each item on the survey, participants were allowed to not answer if they felt uncomfortable. Nonetheless, only 1.8% of the total possible responses were left unanswered by the participants, indicating a very high level of participation.
Findings
Objective 1: Participant Demographics & Experiential Subgroups
As Table 1 shows, 53% of the participants were drawn from teacher education courses, and because of the predominance of women in the field of teaching, the sample is weighted 2 to 1 toward female participants. Eighty percent of the sample was from families who had been in Georgia for at least one generation, with more than a third tracing their Peach State roots back to the 1800s. As mostly native Georgians, the sample reflects the state’s current status as a red state, with a near majority, 44%, self-identifying as Republicans, Conservatives, or Tea Party members. In comparison, a 2011 poll of registered Georgia voters showed a Republican / Democrat / Independent breakdown of 38 / 35 / 27% (Davis & Stirgus, 2012). Thus the study sample was somewhat more conservative than the state’s electorate, a fact explained by the underrepresentation of traditionally left-leaning populations. African Americans only account for 19% of the sample, while they are 31% of the state’s populace, and Latinos are only 5% of the sample as compared to 9% of the state (U.S. Census, 2013).
Note that, although Libertarians often agree with conservative perspectives, when asked about immigration issues, the self-identified Libertarians in our sample tended strongly toward liberal opinions. This can be explained by Libertarians’ preferences for non-regulation and free-market policy making (Pew Research, 2014).
Table 1: Demographics of Participants
| Characteristic of Participant: | Educators | Non-Educators | All | ||||
|---|---|---|---|---|---|---|---|
| N | % | N | % | N | % | ||
| Academic Level | Undergraduate | 158 | 83 | 169 | 100 | 327 | 91 |
| Graduate | 32 | 17 | – | – | 32 | 9 | |
| Age | Under 20 | 75 | 40 | 142 | 84 | 217 | 60 |
| 21-25 | 86 | 45 | 26 | 15 | 112 | 31 | |
| 26-30 | 29 | 15 | 1 | – | 30 | 9 | |
| Gender | Female | 166 | 87 | 72 | 43 | 238 | 66 |
| Male | 24 | 13 | 97 | 57 | 121 | 34 | |
| Family Generations in GA | 1-2 | 53 | 28 | 72 | 43 | 125 | 35 |
| 3-5 | 54 | 28 | 44 | 26 | 98 | 27 | |
| Earlier | 78 | 41 | 50 | 30 | 128 | 36 | |
| Hometown | Urban | 14 | 7 | 20 | 12 | 34 | 9 |
| Suburban | 64 | 34 | 64 | 38 | 128 | 36 | |
| Small Town | 66 | 35 | 49 | 29 | 115 | 32 | |
| Rural | 44 | 23 | 31 | 18 | 75 | 21 | |
| Family Income | < $30,000 | 18 | 9 | 9 | 5 | 27 | 8 |
| $30 -100K | 101 | 53 | 76 | 45 | 177 | 49 | |
| > $100,000 | 33 | 17 | 41 | 24 | 74 | 20 | |
| Self-ID Politics | Democrat /Liberal/Libertarian | 55 | 29 | 34 | 20 | 89 | 25 |
| Independent | 22 | 12 | 23 | 14 | 45 | 13 | |
| Republican/Conservative/Tea | 81 | 43 | 77 | 46 | 158 | 44 | |
| Race/Ethnic | White/White American/American | 158 | 83 | 110 | 65 | 268 | 78 |
| Black/African American | 34 | 18 | 36 | 21 | 70 | 19 | |
| Native American | 9 | 5 | 10 | 6 | 19 | 5 | |
| Latino / Hispanic | 7 | 4 | 12 | 7 | 19 | 5 | |
| Asian &/or Middle Eastern | 4 | 2 | 7 | 4 | 11 | 3 | |
Although 25% of Georgians live in the state’s fourteen metropolitan center counties, only 9% of the sample was urbanites. Instead, small town natives are overrepresented in the sample at 25%, when only 10% of Georgians live in such areas (U.S. Census, 2010; UGA CFCS, 2014). Regarding family income, almost 19% of Georgia’s families live on an annual income of less than $25,000 (U.S. Census, 2014). However, only 8% of the sample estimates their family income under $30,000, reflecting the fact that enrollment in four-year college programs is not a feasible financial possibility for many impoverished Americans (Pew Research, 2014).
Background prompts with especially high and significant Pearson correlations (greater than .300) with each other – indicating possible underlying latent variables – were used for a Principle Component Factor Analysis. This analysis demonstrated that 49.7% of the prompts’ total variance could be explained in terms of four sensible latent variables: White Conservatives, Rural Aggies, Non-Cosmopolitans, and Female Teachers. The four rotated factors emerged from an Oblimin Rotation (Δ = 0) with Kaiser Normalization and Anderson-Rubin scoring. Table 2 describes the four factors and names them as background subgroups according to the underlying experiences with which they most strongly correlate positively or negatively.
Table 2: Background Factor Subgroups and Correlating Demographics/Experiences
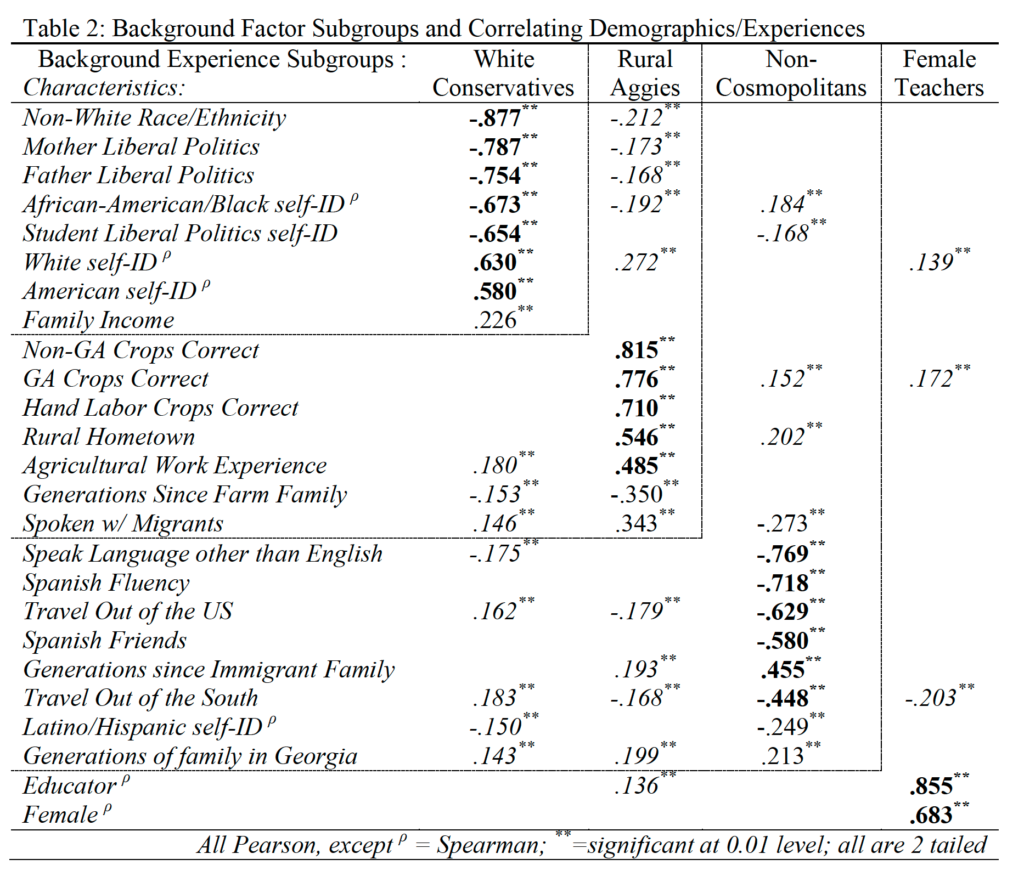
Note that the “Non-White Race/Ethnicity” characteristic listed here is a compound variable intended to account for participants with multiple race/ethnic identities. The variable ranges from 2 to -2 such that a participant self-identifying as both Black and Asian, for example, would score 2, while another participant self-identifying as White and American would score -2, and a Black and White participant would total 0. American and White were treated as the equivalent ethnic/racial identities for our purposes because census data shows that racially “White” Southerners increasingly self-identify ethnically as only “American” (U.S. Census, 2004).
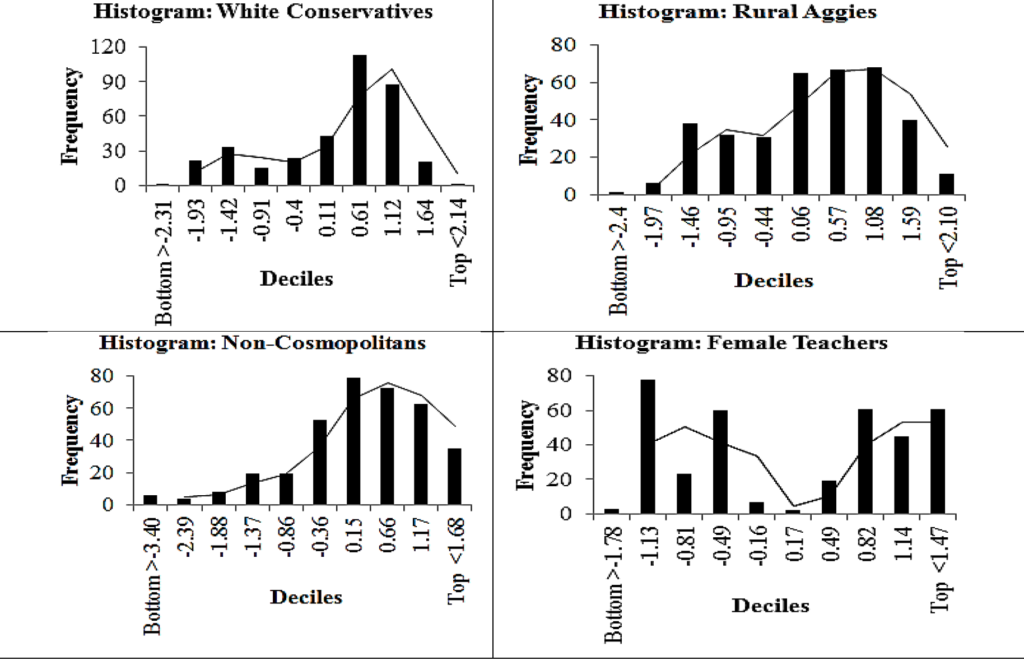
As would be expected from a factor analysis, these four background factor subgroups stand largely independent of (nearly orthogonal to) each other. The only exception being a small .160 Pearson correlation (significant at the .01 level) between the White Conservative and Rural Aggie factors. All four background factors have M = 0 and SD ≈ 1. The histograms in Graphic 1 display the distribution of the factors across the entire sample.
Graphic 1: Histograms of Background Experience Factor distributions across sample
Objective 2: Attitudes, Most & Least Controversial Prompts, Educators’ Responses
The 51 prompts (N range 347 to 359; listwise valid N = 283) are listed in Table 3 sorted by mean (M) response, ranging from agreement at M = 1.79 to M = 3.92, disagreement. The statements with the strongest levels of agreement tended to be either demonstrably factual or regarding the children. Most of the prompts with high rates of rejection exemplify some of the strongest anti- immigrant rhetoric currently popular on the right-wing of American political discourse. The Note column includes a variety of codes regarding individual prompts:
- CS = Consensus prompt: small SD (.692 to .828) and high skewness (.350 to .855).
- CT = Controversial: large SD (1.061 to 1.309) and large negative kurtosis (-.855 to -1.168).
- ED = Educators disagreed at notably higher rate (difference of M > .300).
Note that the AF (Attitude Factor) column will be explained below in Objective 4.
Table 3: Mean Responses to Attitude Prompts
| Prompt (some abbreviated) 1=strongly agree, 5=strongly disagree | M | SD | Note | AF |
|---|---|---|---|---|
| Hard work is good for you and should make you proud. | 1.79 | 0.81 | CS | tv |
| Pesticide poisoning causes farm workers long-term health problems. | 1.83 | 0.69 | ||
| Undocumented children that are in the USA will likely be here as adults. | 2.04 | 0.69 | CS | |
| Undocumented students brought here as children who have good academic& clean criminal records should be encouraged to go to college. | 2.06 | 0.90 | pe | |
| We should educate the children of people who produce our food. | 2.11 | 0.79 | pe | |
| Immigrants bring new ideas and a willingness to work hard to the USA. | 2.24 | 0.85 | pi | |
| Children should never have to work to help feed their families. | 2.25 | 1.07 | ||
| It makes more sense to educate undocumented children now than pay thecosts of having a large number of uneducated people here later. | 2.25 | 0.91 | pe | |
| If a foreigner has education and skills we need for our economy, we shouldallow him/her to legally immigrate to the USA. | 2.30 | 0.87 | pi | |
| Immigration is one of the things that made this country great. | 2.31 | 1.02 | pi | |
| Welcome anyone who wants to live, work & play-by-the-rules in the USA. | 2.33 | 0.96 | pi | |
| Undocumented workers are exploited & mistreated by employers here. | 2.37 | 0.97 | tv | |
| Many pregnant women cross the border into the USA just to give birth toan ‘anchor’ baby – a baby who is an American citizen at birth. | 2.41 | 0.86 | au | |
| Society is morally obligated to educate children of migrants/illegal aliens. | 2.41 | 0.92 | pe | |
| Per capita, the USA welcomes more immigrants/refugees than any other. | 2.49 | 0.83 | CS | tv |
| The U.S. government was correct in changing immigration procedures forall immigrants after the terrorist attacks of 9/11/2001. | 2.50 | 1.04 | au | |
| I’m willing to pay extra for food grown and harvested by legal workers. | 2.54 | 1.01 | ||
| Require everyone who comes to the USA to learn English w/in 3 years. | 2.56 | 1.05 | lx | |
| If a foreigner is willing to work hard at a job most Americans are unwillingto do, we should allow him/her to immigrate to the USA. | 2.69 | 1.02 | em | |
| Farmers should provide comfortable & safe housing for farm workers. | 2.69 | 1.10 | em | |
| Illegal aliens in the USA reduce the wages earned by real Americans. | 2.72 | 1.01 | em | |
| We can’t offer amnesty to illegals because others will follow behind them. | 2.77 | 0.88 | au | |
| Crossing the border w/out documentation should be a deadly risk. | 2.77 | 1.11 | ED | au |
| If a foreigner is a refugee, we should allow him/her to immigrate to USA. | 2.82 | 1.09 | em | |
| Real Americans lose jobs to illegal aliens. | 2.83 | 1.12 | au | |
| USA is obligated to give sanctuary to the world’s poor, huddled masses. | 2.84 | 1.07 | pc | |
| People in the USA w/out documentation should be protected by our laws. | 2.84 | 1.09 | tv | |
| The USA can’t be safe without absolute & total control over its borders. | 2.86 | 1.04 | pc | |
| The current situation – with millions of illegal aliens in the USA – ischallenge unlike anything our nation has ever faced before. | 2.88 | 1.02 | au | |
| If a foreigner is very rich, we should allow him/her to immigrate to USA. | 2.89 | 1.06 | pi | |
| The government puts too many rules and regulations on farmers. | 2.90 | 0.82 | ||
| Parents’ status, not birth location, should determine a baby’s citizenship. | 2.94 | 1.11 | au | |
| When people are speaking a language I do not understand, I worry that they are talking about me. | 2.95 | 1.21 | CT | lx |
| Illegal aliens cost us more than they contribute to our economy. | 2.97 | 1.01 | au | |
| Because people producing food I eat are paid poorly, I have more money. | 3.04 | 1.04 | ||
| If farmers do not provide acceptable housing for their farm workers, thefarmers will be in trouble with government regulators. | 3.07 | 1.10 | em | |
| I am uncomfortable with people speaking a language I don’t understand. | 3.07 | 1.21 | CT | lx |
| If a teacher suspects that a student and/or their family is undocumented,they should call the federal immigration enforcement agency. | 3.09 | 1.04 | em | |
| Everyone in America has an equal chance to succeed. | 3.21 | 1.29 | CT | tv |
| Without farm workers, we would develop machines to take their place. | 3.22 | 1.06 | CT | bm |
| All people in the USA should be required to speak English in public. | 3.26 | 1.19 | CT | lx |
| As a teacher, I’d be uncomfortable w/ students who didn’t speak English. | 3.29 | 1.09 | lx | |
| Farm workers shouldn’t complain, they knew what they were getting into. | 3.32 | 1.05 | bm | |
| Schools aren’t legally obligated to teach migrants and illegal aliens. | 3.41 | 1.10 | ED | pe |
| Farm work is neither particularly hard nor dangerous. | 3.51 | 1.31 | CT | em |
| Our country needs to deport all the illegal aliens right away. | 3.55 | 1.01 | au | |
| American immigration laws treat people of all countries fairly & equally. | 3.59 | 0.99 | bm | |
| Farm workers should not complain – at least they have a job. | 3.61 | 1.09 | ED | pc |
| Migrants don’t value education b/c they bring children to fields to work. | 3.65 | 0.98 | ED | bm |
| Moving from place-to-place all the time would be an adventure for a child. | 3.89 | 0.97 | bm | |
| I do not trust people who are speaking a language other than English. | 3.92 | 0.94 | lx |
The three strongest consensus prompts had a mean of less than 2.5, indicating that the consensus was to agree with these prompts. Two of them correlate with the “Traditional Values” attitude factor (explained in Objective 4) indicating that part of their appeal is that they are derived from the discourse of American exceptionalism and national pride (Hodgson, 2009).
The six outlying controversial prompts had means of 2.95 or higher, indicating that participants tended to be neutral to skeptical about them. One controversial prompt, regarding equality of opportunity, can also be considered part of the Rhetoric of American “Traditional Values.” Half of the controversial prompts conveyed hostility toward languages other than English. The last two highly controversial prompts (“Farm work is neither particularly hard nor dangerous” and “Without farm workers, we would develop machines to take their place”) demonstrated the range from knowledge to ignorance about farm work within our sample.
Four prompts with means for educators that differed by more than 0.3 were noted. Interesting, there were no prompts that educators agreed with at a substantially higher rate – teachers only disagreed more. These four prompts had means of 2.77 or higher, indicating that the sample was already neutral to skeptical about them. Paralleling the most controversial prompts, these four prompts convey a conservative perspective. Thus, with their higher level of disputation, the educators indicated a more liberal perspective regarding these issues.
Objective 3: Liberal-Conservative Political Orientation: The “Nurturing Liberal” factor
A composite factor was created by applying Lakoff’s (2010) argument that the metaphor of ‘government as parent’ can provide useful insight into the thinking of liberals and conservatives in the U.S. Lakoff states that liberals consistently use language that supports a “nurturing and supportive” role for government, while conservatives invoke a “strict disciplinarian” approach. On the basis of this dichotomy, attitude prompts were semantically categorized. Participants’ pro-nurturing responses were summed and their pro-disciplinarian responses subtracted to construct a composite “Nurturing Liberal” factor (range 45 to 194, M = 94.2, SD = 19.2) that rose in value with participants’ agreement with a “supportive” role for government.
Evidence for the validity of the composite Nurturing Liberal factor is to be found in its strong correlations with both the participants’ self-reported liberal political affiliation (.504) and with the White Conservative background factor (-.263). Other experience subgroups that correlated significantly with Nurturing Liberal were Non-Cosmopolitans (-.308) and Female Teachers (.249). All of these correlations are two-tailed Pearson and significant at the .01 level.
Correlations with the Nurturing Liberal factor allow us to identify the prompts that provoked the most extreme responses. They range from -.587 for the most conservative prompt “Our country needs to deport all the illegal aliens right away” to .457 for the most liberal prompt “It makes more sense to educate undocumented children now than pay the costs of having a large number of uneducated people here later.” As seen during the current crisis regarding unaccompanied children along the Mexican border, issues regarding undocumented immigrants are very divisive, provoking clear correlations between participants’ politics and their responses. The two other most liberal prompts also concerned this issue: “Undocumented students brought here as children who have good academic and clean criminal records should be encouraged to go to college” (.446) and “People in the USA without documentation should be protected by our laws” (.443).
The divisiveness of the issue of immigrants without papers is reinforced by the fact that three of the four most conservative prompts also regarded undocumented immigration, including “Illegal aliens cost us more than they contribute to our economy.” (-.472). Other prompts that tended to result in polarized correlations regarded language and education – facts that will be reflected later in Objective 5 as the Pro-Education and Linguistic Xenophobia attitude response factors will be shown to have the most extreme correlations with the Nurturing Liberal factor.
Objective 4: Attitude Response Factors and their Politics
A Principle Component Factor Analysis was conducted upon the responses to the attitude prompts, excepting five prompts with problematic response patterns that did not correlate well with any other responses. It was shown that 39.5% of the total variance could be explained in terms of eight intuitively and semantically valid latent variables: Pro-Education; Pro-Immigrant; Empathy for Migrants and Poor; Pro-Immigration Control; Rhetoric of ‘Blame the Migrants,’ Anti-Undocumented; Rhetoric of ‘Traditional Values,’ and Linguistic Xenophobia. These emerged from an Equamax Rotation with Kaiser Normalization and Anderson-Rubin scoring. The factors range in value from approximately -5 to 3.5, with M ≈ 0 and SD ≈ 1. In order to further explain the nature of these attitude response factors, they are listed in column AF in Table 3 alongside their most significantly correlating prompts.
As Table 4 shows, all eight attitude response factors correlated significantly with the Nurturing Liberal factor. Liberals were strongly Pro-Education and Pro-Immigrant in their responses. Meanwhile, conservatives displayed Linguistic Xenophobia and Anti-Undocumented sentiments, and accepted the rhetorics of Traditional Values and Blame the Migrants. These correlations parallel those from the students’ self-reported political affiliations. The educators in our sample tended toward more liberal positions: opposing strong immigration controls, rejecting both the rhetorics of Traditional Values and Blame the Migrants, while supporting education.
Table 4: Significant Correlations: Attitude Response Factors v. Politics & Educator
| Attitude Response Factors | Nurturing Liberal | Student Liberal Politics self-ID | Educators ρ |
|---|---|---|---|
| Pro-Education | .383** | .258** | .150** |
| Pro-Immigrant | .365** | .185** | |
| Empathy Migrants & Poor | .194** | ||
| Pro-Immigration Control | -.110* | -.169** | |
| Rhetoric of Blame the Migrants | -.324** | -.341** | |
| Anti-Undocumented | -.400** | -.204** | |
| Rhetoric of Traditional Values | -.410** | -.362** | -.143** |
| Linguistic Xenophobia | -.434** | -.230** |
Objective 5: Demographics and Experience vis-à-vis Response Factors
Table 5 identifies all significant correlations between the background and attitude factors developed in this manuscript.
Table 5: Significant Correlations: Background Experiences v. Attitude Factors – All Participants
| Background Experience Subgroups: Attitude Factors | White Conservatives | Rural Aggies | Non-Cosmopolitans | Female Teachers |
|---|---|---|---|---|
| Pro-Education | -.186** | -.128* | .191** | |
| Pro-Immigrant | -.124* | |||
| Empathy Migrant/Poor | -.107* | |||
| Pro-Immigration Control | -.126* | |||
| Rhetoric of Blame the Migrants | -.114* | -.209** | -.351** | |
| Anti-Undocumented | – | – | – | – |
| Rhetoric of Traditional Values | .307** | .160** | -.154** | |
| Linguistic Xenophobia | .109* | .346** |
The most conservative attitude factors (identified in Table 4) do not find uniform support from any of the background subgroups. Non-Cosmopolitans did not correlate with Traditional Values, but did express a high level of discomfort with diversity through their adherence to Linguistic Xenophobia. Opposingly, White Conservatives agreed very strongly with invocations of Traditional Values, but only weakly with Linguistic Xenophobia. Intriguingly, although Rural Aggies also supported Traditional Values, they notably rejected the Rhetoric of Blame the Migrants. Even more strongly opposed to Blaming Migrants were Female Teachers. Anti- Undocumented attitudes did not correlate significantly with any subgroup, possibly due the current divisiveness of these issues. A closer look at specific demographic and experiential items in Table 6 allows some further insight into some of the underlying details.
Table 6: Significant Correlations: Specific Demographics / Experiences v. Attitude Factors
| Backgrnd: Attitude | Male ρ | Black ρ | Latino ρ | Fmly In¢m | Spoke w/Migr | Agric Exprc | Gens Farm | Travel >South | Travel >USA |
|---|---|---|---|---|---|---|---|---|---|
| Pro-Educ. | .17** | -.12* | |||||||
| Pro-Imm. | -.13* | ||||||||
| Emp. Migr. | .13* | -.13* | |||||||
| ProImmCtrl | -.15* | -.13* | .13* | ||||||
| Blame Migr. | .23** | .13* | -.18** | -.18** | |||||
| Anti-Undoc | -.15** | ||||||||
| TradValues | -.30** | .14* | .17** | .16** | -.12* | ||||
| LingXnoph | -.11* | -.17** | -.11* |
Table 6 shows that some specific demographic groups held strong attitudes. Males were strongly associated with the Rhetoric of Blame the Migrant, while African Americans correlated mildly with the same. More significantly, Blacks overwhelmingly rejected Traditional Values rhetoric. Notably, Latinos held particularly strong Pro-Education attitudes, other than teachers themselves.
Surprisingly, increased Family Income was not a strong indicator of many attitudes, only correlating mildly with reduced Pro-Immigrant and increased Traditional Values sentiments. Experience working in farming and speaking with migrants has some significant correlations: reducing support for strict immigration control and Blame the Migrant rhetoric. This is despite the fact that both background experiences correlate significantly and positively with adherence to Traditional Values. Somewhat expectedly, travel beyond the South and outside the U.S. is a counterweight to Linguistic Xenophobia.
Conclusions, Recommendations and Questions for Further Research
If agriculture educators are to take up the challenge of cultivating open and honest dialogues about migrancy, immigration and farming among both their students and their colleagues, they need to be aware that they have multiple audiences to address within these groups. For example, a group of generally politically conservative students can hold very different attitudes about the issues at hand. White Conservatives can be distinguished from Non-Cosmopolitans on the basis of both their life experiences and their divergent responses to Traditional Values and Linguistic Xenophobia. Non-Cosmopolitans’ personal fear of diversity and discomfort with non-English speakers suggests that positive personal interaction with immigrants could address some of their concerns. However, for White Conservatives, a more fact-based challenge to their Rhetoric of Traditional Values might be in order. For both groups, hearing their Rural Aggie classmates’ attitudes, rooted in both personal experience with migrants and technical knowledge of farming, would appear to have transformational potential.
Conversations and more formal training with other teachers, especially groups that are, like the teacher workforce in general, predominantly female can assume a higher level of support for migrants and immigrants. It is around the Rhetoric of Blame the Migrants that gender differences become most acute. Statements about migrants being at fault for their own circumstances are common among men, but even more uncommon among female teachers. This difference is a likely source of debate in mixed-gender groups.
Although this first analysis of the data has yielded significant findings, there are a number of questions that remain to be addressed through further data collection and analysis:
- How does the generally conservative politics of rural communities interact with the liberalizing (regarding issues of migrancy and immigration) effects of interacting and working with migrants in agricultural settings?
- Do specific demographic subgroups (male/female, rural/urban, race and ethnicity, income, etc.) within the larger background factor subgroups diverge from those groups in significant ways? What about individuals who bridge seemingly divergent subgroups? What of Female Teachers who come from strongly White Conservative or Non- Cosmopolitan backgrounds? Or African Americans with Rural Aggie experience?
- How can the attitudes of students and teachers best be informed and challenged? What pedagogies, literature, and experiences are most effective regarding these issues? Which attitudes are most/least easily challenged and among which subpopulations?
Further data collection and analysis may allow us to form a clearer picture of how the various elements identified thus far in this study weigh upon and interact with each other. In the meantime, it is hoped that agriculture educators will accept the challenge of explaining our nation’s dependence on migrants and immigrant labor and work to propagate and inform thoughtful conversations among both their colleagues and students.
References
Baker, D., & Chappelle, D. (2012). In Vermont, se habla Español: Using occupational Spanish to help dairy farmers manage a changing workforce. Journal of Extension, 50(3).
Barrera, R., Quiroa, R.& West-Williams, C. (1999). Poco a poco: The continued development of Mexican American children’s literature in the 1990s. The New Advocate, 12(4), 315-331.
Beck, S. (2003). ” We were the first ones”: oral histories of Mexican heritage women pioneers in the schools of rural southeast Georgia, 1978-2002 (Doctoral dissertation, University of Georgia).
Beck, S. (2004). The challenge of change: A gringo remembers tough choices. In Salinas, C., & Fránquiz, M. E. (2004). Scholars in the field: The challenges of migrant education. Charleston, WV: AEL., 227–239.
Beck, S. (2009) Children of migrant farm workers in picture storybooks: Reality, romanticism, and representation. Children’s Literature Association Quarterly, 34(2), 97–137.
Brophy, J. E., & Good, T. L. (1974). Teacher-student relationships: Causes and consequences. Orlando: Holt, Rinehart & Winston.
Carroll, D., Georges, A., & Saltz, R. (2011, May). Changing characteristics of U.S. farm workers: 21 years of findings from the national agricultural workers survey. Presentation at the Conference on Immigration Reform: Implications for Farmers, Farm Workers, and Communities, University of California at Davis.
Case, S. A. (2013). Thank You for Taking Our Jobs: The Importance of Integrating the Migrant Farm worker into the United States. Wyoming Law Review, 37(1), 349-375.
Davis, J & Stirgus, E. (2012, September 3). Which party has more supporters? AJC Politifact. Retrieved from http://www.politifact.com/georgia/statements/2012/sep/10/mike- berlon/which-party-has-more-supporters/
Driscoll, D. M. (2003). Target-audience-specific networking groups: Could they be helpful in your work?. Journal of Extension, 41(5).
Fink, L. (2003). The Maya of Morgantown: Work and community in the nuevo new South. Chapel Hill: UNC Press.
Gay, G. (2010). Culturally responsive teaching: Theory, research, and practice. New York: Teachers College Press.
Haughney, C. (2013, April 23) The Times Shifts on ‘Illegal Immigrant,’ but Doesn’t Ban the Use. New York Times. Retrieved from http://www.nytimes.com/2013/04/24/business/media/the-times-shifts-on-illegal- immigrant-but-doesnt-ban-the-use.html?pagewanted=all&_r=1&
Hodgson, G. (2009). The myth of American exceptionalism. New Haven: Yale University Press. Hoffman, A., & Daniels, S. (1995). A Study of Stereotypes of Farmers in Children’s Literature. Journal of Children’s Literature, 21(2), 1–5.
Holmes, S. (2013). Fresh fruit, broken bodies: Migrant farm workers in the United States. Berkeley: University of California Press.
Hurst, T., & Sperry, L. (2000). A Vision For K-12 Education In And About Agriculture And Natural Resources. Agricultural Education Magazine, 73(1), 18-19.
Jack, K. (2005). Trouble in the farm yard: Labor relations and politics in Doreen Cronin’s duck books.” Children’s Literature Association Quarterly, 30(4), 409–25.
Kelsey, K. D., Weeks, W., & Terry Sr, R. (2002). Important issues facing agriculture in Oklahoma: An analysis of agricultural leaders’ perspectives. Journal of Southern Agricultural Education Research, 52, 52-61.
Kruse, M. (2001) Aprons, overalls, and so much more: Images of farm workers in children’s picture books.” Journal of Children’s Literature, 27(2), 22–28.
Lakoff, G. (2010). Moral politics: How liberals and conservatives think. Chicago: University of Chicago Press
Lamme, L.L., Fu, D., & Lowery, R.M. (2004) Immigrants as portrayed in children’s picture books. Social Studies, 95(3), 123–29.
Lobley, J., & Peronto, J. (2007). Experiential learning in workforce preparation—An application for success. Journal of Extension, 45(3).
Mantero, J. M. (2008). Latinos and the U.S. South. Westport, CT: Praeger Publishers.
Marrow, H. (2011). New destination dreaming: Immigration, race, and legal status in the rural American South. Stanford: Stanford University Press.
Martin, P. L. (2003). Promise unfulfilled: unions, immigration, and the farm workers. Ithaca: Cornell University Press.
McGlinn, J. (2004). Rags to riches: The Horatio Alger theme in adolescent novels about the immigrant experience. ALAN Review, 31(3), 11–15.
Mullinix, K., Garcia, L., Lewis-Lorentz, A., & Qazi, J. (2003). Latino views of agriculture, careers and education: Dispelling the myths. NACTA Journal, 47(4), 1-15.
Murillo, E. G. (2002). How does it feel to be a problem?: “Disciplining” the transnational subject in the American South. In Wortham, S. E. F., Murillo Jr, E. G., & Hamann, E. T. (Eds.). (2002). Education in the new Latino diaspora: Policy and the politics of identity. Westport, CT: Greenwood, 215-240.
Murphy, A. D., Blanchard, C., & Hill, J. A. (Eds.). (2001). Latino workers in the contemporary South (Vol. 34). University of Georgia Press.
Nilsson, N. (2005). How does Hispanic portrayal in children’s books measure up after 40 years? The answer is ‘it depends.’ Reading Teacher, 58(6), 534–48.
Odem, M. E., & Lacy, E. C. (Eds.). (2009). Latino immigrants and the transformation of the U.S. South. Athens: University of Georgia Press.
Ortega, R. R., Tormoehlen, R. L., Field, W. E., & Machtmes, K. L. (2003). Determining critical subject matter content for a safety certification program for youth employed in agricultural production. Journal of Agricultural Education, 44(4), 67-79.
Owens, E. W. (2008). Peacocks of the fields: The working lives of migrant farms workers. Bloomington: Author House.
Pew Research Center. (2014, January 15). College enrollment among low-income students still trails richer groups. Pew Research. http://www.pewresearch.org/fact- tank/2014/01/15/college-enrollment-among-low-income-students-still-trails-richer- groups/
Pew Research Center for the People and the Press. (2014, June 26). Beyond red vs. blue: The political typology. Pew Research. Retrieved from http://www.people- press.org/2014/06/26/the-political-typology-beyond-red-vs-blue/
Rich, J., Duncan, D. W., Navarro, M., & Ricketts, J. C. (2009). Examining differences in middle school student achievement on a criterion-referenced competency test (CRCT) in science. Journal of Agricultural Education, 50(4), 14-24.
Rothenberg, D. (1998). With these hands: The hidden world of migrant farm workers today. New York: Harcourt Brace.
Salinas, C., & Fránquiz, M. E. (2004a). Scholars in the field: The challenges of migrant education. Charleston, WV: AEL.
Salinas, C., & Franquiz, M. E. (2004b). Preface: Making migrant children and migrant education visible. In Salinas, C., & Fránquiz, M. E. (2004a). Scholars in the field: The challenges of migrant education. Charleston, WV: AEL., xi-xviii.
Smith, A. (2010, July 10). Farm workers: Take our jobs, please! CNN Money. Retrieved from http://money.cnn.com/2010/07/07/news/economy/farm_worker_jobs/
Smith, H. A., & Furuseth, O. J. (Eds.). (2006). Latinos in the new South: Transformations of place. Hampshire, UK: Ashgate.
Thompson, C. D., & Wiggins, M. F. (Eds.). (2009). The human cost of food: Farm workers’ lives, labor, and advocacy. Austin: University of Texas Press.
Thompson, G. (2011). Working in the shadows: A year of doing the jobs (most) Americans won’t do. New York: Nation Books.
University of Georgia College of Family and Consumer Sciences (2014). Georgia Facts. Retrieved from http://spock.fcs.uga.edu/hace/gafacts/
U.S. Census. (2004). Census 2000 Brief: Ancestry: 2000. Retrieved from http://www.census.gov/prod/2004pubs/c2kbr-35.pdf
U.S. Census. (2010). Census Urban Lists Record Layouts. Retrieved from http://www.census.gov/geo/reference/ua/ualists_layout.html
U.S. Census. (2013). State & County QuickFacts: Georgia. Retrieved from http://quickfacts.census.gov/qfd/states/13000.html
U.S. Census. (2014). American FactFinder. Retrieved from http://factfinder2.census.gov/faces/nav/jsf/pages/index.xhtml
Valle, I. (1994). Fields of toil: A migrant family’s journey. Pullman: Washington State University Press.
Varela, J.R. (2013, February 4). This year’s best Super Bowl ad “So God made a farmer” ignores reality. NBC Latino. Retrieved from http://nbclatino.com/2013/02/04/opinion- this-years-best-super-bowl-ad-so-god-made-a-farmer-ignores-reality/
Villenas, S. (2002). Reinventing educación in new Latino communities: Pedagogies of change and continuity in North Carolina. In Wortham, S. E. F., Murillo Jr, E. G., & Hamann, E. T. (Eds.). (2002). Education in the new Latino diaspora: Policy and the politics of identity. Westport, CT: Greenwood, 17-35.
Viramontez-Anguiano, R. P. (2001). Planting seeds family enrichment program: Serving rural immigrant Hispanic families and their youth in eastern North Carolina. Journal of Extension, 39, 1-3.
Wallace, M. (2008). Engaging Migrant Families in Extension Technology Programs. Journal of Extension, 46(3).
Walker, A., Shafer, J., & Iiams, M. (2004). Not in my classroom: Teacher attitudes towards English language learners in the mainstream classroom. NABE Journal of Research and Practice, 2(1), 130-160.
Whittaker, C. R., Salend, S. J., & Gutierrez, M. B. (1997). Voices from the fields: Including migrant farm workers in the curriculum. The Reading Teacher, 50(6), 482-493.