Nicholas R. Brown, Jenks Middle School, OK
Robert Terry, Jr., Oklahoma State University
J. Shane Robinson, Oklahoma State University
Abstract
In the 1970s, the number of FFA camps expanded quickly across the country with the goal of increasing leadership capacities of FFA members. Although FFA camps were designed, originally, as a fun medium to increase leadership skills, current data suggests that camps also can improve students’ content knowledge. The two major domains that impact the outcome of learning are cognitive and affective. Although recent research has been conducted regarding cognitive achievement at FFA camps, scholars have called for additional research on youth development related to the affective domain. The purpose of this descriptive-correlational study was to measure the relationship between the cognitive and affective learning domains of FFA members who attended Oklahoma FFA Alumni Leadership Camp. Although camp participants have an overall positive attitude about camp, there is no relationship between what they learned during small group sessions and their attitude toward the overall camp experience. As a result of this study, those responsible for planning the Oklahoma FFA Alumni Leadership Camp are advised to discontinue the use of academically structured learning material during small group sessions and consider incorporating activities that will help campers improve their learning of leadership concepts in the context of outdoor activities and recreation.
Introduction and Background
In excess of 10 million children attend a youth camp each year (American Camp Association [ACA], n.d.). Typically, youth camps are held outdoors during the summer months with a curriculum delivered by trained leaders (Henderson, Bialeschki, & James, 2007). When people think of attending a camp, they usually envision a fun, enjoyable environment that offers multiple opportunities for making new friends and participating in engaging activities (Henderson et al., 2007). Camps can, however, serve as serious learning environments where life skills, such as problem solving, decision making, and respecting others, are learned (Thurber, Scanlin, Scheuler, & Henderson, 2007, p. 251). One such camp offered each year with the intent to improve learning is the Oklahoma FFA Alumni Leadership Camp (Brown & Terry, 2013).
In the 1970s, FFA camps expanded quickly in individual states across the country with the goal of increasing leadership capacities of FFA members (Hoover, Scholl, Dunigan, & Mamontova, 2007). In addition to learning valuable leadership skills, FFA camps allow students to meet new friends, participate in recreational activities, and make lifelong memories (Connors, Falk, & Epps, 2010). Although leadership development has been the primary focus of FFA summer camp activities, numerous states also incorporated experiences related to conservation and environmental stewardship (Connors et al., 2010).
Although FFA camps were designed, originally, as a fun medium to increase leadership skills, current data suggests that camps also embed an element of seriousness and can improve students’ content knowledge. In a recent study, Brown et al. (2013) found that youth doubled their knowledge associated with a program focusing on communications offered during the three and one-half-day experience. Data were generated from a pretest to a posttest criterion-referenced examination based on objectives of the camp. However, when assessing content knowledge six months later, via a deferred posttest, long-term retention of this knowledge was found to be negligible, causing the researchers to question the impact of FFA camp on the outcome of learning.
The two major domains that impact the outcome of learning are cognitive and affective (Kraiger, Ford, & Salas, 1993). Learning is multidimensional and may be impacted by a person’s cognitive and affective capacities (Gagne, 1984). The cognitive domain of learning encompasses activities impacting a person’s mental ability to process, store, and retrieve information and includes the mental strategies necessary for learning new content (Kraiger et al., 1993). The affective domain, however, focuses more on the person’s feelings and attitudes and is associated with how people relate to or connect with the material (Kraiger et al., 1993). Affective learning impacts a person’s feelings, moods, and emotions with the material. Although both the cognitive and affective domains affect learning, “The affective domain can be characterized as being indirectly linked to learning outcomes” (Boyle et al., 2007, p.301).
One factor that could relate to students’ attitudes while attending camp is the instructor in charge of delivering content (Brown & Terry, Jr., 2013). In fact, Bialeschki, Henderson, and James (2007) stated, “camp is not inherently good without purposeful and directed efforts by camp professionals” (p. 770). Among other things, camp instructors can help students improve their “teamwork, social skills, and initiative” (Ferrari & McNeely, 2007, Discussion para.)
Students who are connected to and engaged with the content through the affective domain have improved levels of learning due to their increased understanding, as a result of their emotional connection and motivation (Biggs, 1999). However, unfortunately, students’ emotional connection to what they learn at camp has not always been perceived in the most positive light. In a study of 4-H camp attendees, respondents shared that their friends considered camp to be “stupid, childish, for nerds, corny, lame, cheesy, and boring” (Garst & Johnson, 2005, Results para.). Therefore, Larson (2000) called for additional research on youth development related to the affective domain. One means of measuring the affective domain is by assessing students’ attitudes (Breckler & Wiggins, 1989a; Phillips, 1992).
Theoretical Lens
Attitudes can impact a person’s behavior and performance (Cochran, et al., 2010; Gagne, 1984; Hortwitz, Hortwitz, & Cope, 1986; Onwuegbuzie, Bailey, & Daley, 2000; Shih & Gamoon, 2001). Kelman (2007) identified four factors of attitudes:
1) Attitudes inextricably combine the affective and cognitive dimensions of our relationships to social objects; 2) attitudes are shared within a group, organization, or society and constitute properties of both the individual and the collectivity within which these attitudes are shared; 3) attitudes emerge and constantly evolve and change in a context of action and interaction; 4) an attitude represents a range of potential commitment to the object . . . at times extending from approach to avoidance, from support to opposition – rather than a single point on a bipolar scale. (p. 288)
This study was guided by the attitude theory (Breckler & Wiggins, 1989a). Historically, attitude theory has emphasized the affective domain of learning (Breckler & Wiggins, 1989a). This study was concerned with campers’ attitude extremities throughout the camp experience. Attitude extremities are defined as “the degree of favorableness or favorableness of an individual’s evaluation of a given object” (Krosnick & Abelson, 1992, p. 179). Semantic differential scales assist researchers in learning how subjects respond to a stem statement regarding the extremities of their attitude (Breckler, & Wiggins, 1989b).
“Many theoretical considerations of attitude have, of course, argued that stronger attitudes have stronger links to behavior than weaker attitudes” (Raden, 1985, p. 313). However, attitude and its impact on learning and behavior is a complicated phenomenon. Ajzen and Fishbein (1977) posited that attitude “is one of many factors determining behavior” (p. 888). Similar to other studies, variability has existed in how researchers have used attitudes as predictors in learning (Funk, Haugtvedt, & Howard, 2000).
Wingenbach and Kahler (1997) concluded, “The construct of youth leadership and life skills development is a complex arrangement of experiences, backgrounds, and attitudes, when measured by the perceptions of secondary agricultural education students” (p. 25). As complex as it is, a combination of factors, such as camp goals, small group leaders, perceived emotional safety, and activities help make outcome achievements a possibility (Bialeschki et al., 2007). Because of these numerous factors, the majority of research conducted on camps has been anecdotal in nature (Henderson et al., 2007). Therefore, a need existed to determine the relationship of participants’ overall attitude toward attending a statewide leadership camp, and how it affected their cognitive outcome related to learning the curriculum delivered at the camp.
Purpose and Objectives
The purpose of this study was to measure the relationship between the cognitive and affective learning domains of FFA members who attended Oklahoma FFA Alumni Leadership Camp. Also of interest were interactions between attitude and selected personal characteristics. The study aligns with the American Association for Agricultural Education’s National Research Agenda Priority Four, which focuses on investigating meaningful, engaged, learning in multiple environments (Doerfert, 2011).
The following objectives were formulated to accomplish the purpose of this study:
- Assess campers’ attitudes regarding the overall camp experience.
- Determine the relationship between campers’ leadership knowledge acquired, as a result of the curriculum taught, and their attitudes toward the overall camp experience.
- Determine the relationship between campers’ leadership knowledge retained, as a result of the curriculum taught, and their attitudes toward the overall camp experience.
- Describe the relationship between campers’ selected personal characteristics (sex, race, age, grade level, socioeconomic status, years of camp attendance, chapter FFA officer status, and grade point average) and attitudes regarding the overall camp experience.
Methods
This descriptive-correlational study investigated FFA members (campers) who attended Oklahoma FFA Alumni Leadership Camp in the summer of 2011. Campers were members of the National FFA Organization whose school classification ranged from eighth to twelfth grade. With more than 1,500 Oklahoma FFA members attending the four three and one-half-day camp sessions, we determined a random sample was appropriate. Simple random sampling techniques allowed us to be less intrusive on the camp experience while also collecting data that could be generalized to the entire population of camp participants (Creswell, 2008). According to Krejcie and Morgan (1970), a sample of at least 310 subjects was needed to generalize to the population (N = 1,543). We chose to randomly sample 435 campers from the population to ensure the final sample size would be sufficient. Randomizer.org, a web-based randomization site, was used to generate a list of 435 campers from the population. Forty campers were not granted parental permission to participate, so the sample was condensed to 395. In the end, we achieved an 87% response rate as 344 campers assented to join the study. This high response rate negated any procedures necessary to control for non-response error (Lindner, Murphy, & Briers, 2001).
Data Collection Instruments
Three instruments were utilized to collect quantitative data and meet the objectives of the study: (a) the Camp Communications Content Examination (CCCE), (b) the Alumni Camp Attitude Assessment (ACAS), and (c) a nine-item questionnaire designed to collect campers’ personal characteristics.
In 2011, the camp leadership curriculum focused on interpersonal and intrapersonal communications. We collaborated with Oklahoma FFA staff and camp planners to construct the CCCE, a criterion-referenced exam. The CCCE was designed to measure the level of campers’ cognitive achievement concomitant with the communications curriculum taught at camp. The CCCE consisted of 17 multiple-choice questions, which were cross-walked to the curriculum taught during small group sessions that met throughout the camp experience.
A panel of experts was engaged to assess face and content validity of the CCCE instrument. The panel consisted of three university faculty members in agricultural education, two curriculum designers, and three high school students. Specifically, we relied on the university faculty to critically evaluate the test construction while we asked the curriculum specialists to examine each question for content validity. Finally, we elected to include high school students in the panel to determine if the instructions and writing were age appropriate.
Criterion-referenced exams are used for the purpose of determining the amount of information learned or retained (Kane, 1986). Therefore, conventional reliability indices testing for internal consistency are not necessarily appropriate (Kane, 1986). Instead, we employed the Kuder- Richardson (KR20) formula, as it is the most suitable test for reliability of criterion-referenced items (Cronbach, 1970). The CCCE generated a reliability coefficient of .52 (KR20). Kane (1986) explained that criterion-referenced instruments should produce reliability coefficients above .50 to be deemed reliable. Thus, the CCCE was deemed reliable and valid.
We created the Alumni Camp Attitude Assessment (ACAS), a semantic differential (Osgood, Suci, & Tannenbaum, 1965), to measure the attitudes of campers concerning the camp experience. According to Isaac and Michael (1995), “the semantic differential is a method for measuring the meaning of concepts” (p. 144). Osgood et al. (1965) used factor analysis of 76 pairs of dichotomous adjectives to identify three factors that account for a variety of the semantic differential loadings. The three factors are evaluation, potency, and activeness (Osgood et al., 1965). Isaac and Michael (1995) suggested that pairs of adjectives should be selected from the list of those factor-analyzed and developed by Osgood et al. (1965) and placed on opposing ends of a seven-point summative scale. The instrument should include five to nine pairs of adjectives from each of the three factors (Osgood et al., 1965). Following this advice, we chose five adjective pairs for each of the three factors, and varied the arrangement of each adjective pair so that the potent, evaluative, and activeness ends of the scales were situated on both the left and right positions of the seven-point scale to avoid response pattern development. Table 1 displays the 15 pairs of polar adjectives selected to include in the sematic differential that were developed for the purpose of this study. An attitude score between 1.00 and 3.99 is considered a negative attitude, a score between 4.00 and 4.99 is a considered a neutral attitude, and a score between 5.00 and 7.00 is considered a positive attitude (Isaac & Michael, 1995).
Table 1
List of Pairs of Polar Adjectives Utilized for the Development of Alumni Camp Attitude Assessment (ACAS) Semantic Differential
| Evaluation | Potency | Activeness |
|---|---|---|
| Good – Bad | Hard – Soft | Active – Passive |
| Happy – Sad | Strong – Weak | Fast – Slow |
| Sociable – Unsociable | Large – Small | Difficult – Easy |
| Friendly – Unfriendly | Heavy – Light | Emotional – Unemotional |
| Kind – Cruel | Deep – Shallow | Excitable – Calm |
The same panel of experts reviewed the ACAS for face and content validity. Although all adjective sets were chosen from the list of factor-analyzed adjective pairs developed by Osgood et al. (1965) and were considered standardized, we elected to perform a post-hock reliability analysis of the ACAS. The ACAS generated a reliability coefficient of .70 (Cronbach’s Alpha). As a result, we deemed the ACAS to be both valid and reliable.
Campers’ personal characteristics were collected using a nine-item questionnaire. The instrument included six multiple-option questions, two fill-in-the-blank questions, and an open- ended item. Our panel of experts reviewed the questionnaire for face and content validity.
Research Procedures
During camp registration activities, participating campers were asked to complete the personal characteristics questionnaire. Before leaving camp, campers were asked to complete the ACAS and the CCCE to measure the amount of knowledge acquired. The results of the content examination were utilized to determine the level of cognitive gain associated with the communications curriculum taught by former FFA members during the 12 one-hour small group sessions that met throughout the camp experience. Per the educational literature regarding delayed posttests (Berti & Andriolo, 2001), each camper was instructed to complete the CCCE again six months later. The results of the delayed content examination were employed to determine campers’ cognitive retention (Fleming & Alexander, 2001; Hall & Edmonson, 1992).
We followed Dillman’s Tailored Design (2000) to ensure a high response rate associated with the data collection for the delayed content examination. We decided that communicating with the teachers of each research participant, rather than contacting each camper individually, would achieve the highest possible response rate. The resulting procedures were followed to achieve an optimal response rate (Dillman, 2000):
- Respondent-friendly questionnaire – A panel of experts reviewed the CCCE to ensure that the questions were clear and comprehendible. The panel also reviewed the instrument’s design.
- Four separate mailings to each subject by first class mail, with an additional contact – Each teacher received a letter of pre-notice three days prior to the questionnaire being mailed. The questionnaire was mailed with an explanatory letter included. A thank you/reminder postcard was mailed approximately one week after the questionnaire was received. Replacement questionnaires were mailed to teachers who no longer had the instrument in their possession.
- Return envelopes with first class stamps – A return envelope with a prepaid first class postage stamp affixed accompanied each questionnaire.
- Personalized correspondence – All correspondence was printed on high quality stationary, including names of instructors and original signatures from the researcher.
- Prepaid incentive – Each questionnaire packet included an ink pen branded with the Oklahoma State University logo and the department name. Teachers were encouraged to keep the pen as a token of appreciation for their effort in the data collection process.
As expected, research mortality (Kirk, 1995) occurred. In all, 243 campers completed the delayed content examination, producing a 70.65% response rate. To control for nonresponse error, we compared 20 non-responders to our sample and determined that there was no significant difference between delayed content exam scores of responders and non-responders t(261) = -.56, p = .58. The collection of non-responder data was accomplished by contacting Agricultural Education teachers of those campers’ who did not respond originally.
Analysis of Data
Creswell (2008) explained correlational research is necessitated when “you seek to relate two or more variables to see if they influence each other” (p. 356). Therefore, Pearson’s correlation coefficient r was used to test if relationships existed between camper content examination scores and continuous variables, which are appropriate when determining relationships between test scores and continuous data (Field, 2009). Additional statistical procedures were necessitated to answer the fourth research question. ANOVA was used to determine relationships between campers’ attitude scores and nominal variables with multiple categories (Kirk, 1995). Finally, a t-test was calculated to determine relationships between campers’ attitude scores and nominal variables with only two categories (Kirk, 1995). Appropriate statistical analyses were employed to ensure all assumptions were met (Field, 2009).
“Effect size in the correlational context is referred to as the strength of association between two variables” (Chen & Popovich, 2002, p. 42). Cohen’s (1988) conventional reference of effect size magnitude related to correlations (small = 0.1, moderate = 0.3, large = 0.5) are “relative, not only to each other, but to the area of behavioral science or even more particularly to the specific content and research method being employed in any given investigation” (p. 25). Cohen’s d was calculated for all t-test outputs. Kirk (1995) explained, “Cohen refers to a d value of 0.2 as a small effect size” (p. 64). He added that “ a medium effect size is one for which d = 0.5, and a large effect size is one for which d = 0.8” (Kirk, 1995, p. 64). Partial eta squared (ηp2) was reported for all ANOVA outputs (Kirk, 1995).
Findings
Findings Associated with Objective One
The first objective was to assess attitudes of participants regarding the overall camp experience. Campers’ attitudes were measured by three constructs: evaluation of camp, potency of camp, and activeness of camp. Figure 1 is a diagrammatic illustration of mean attitude scores associated with each construct.
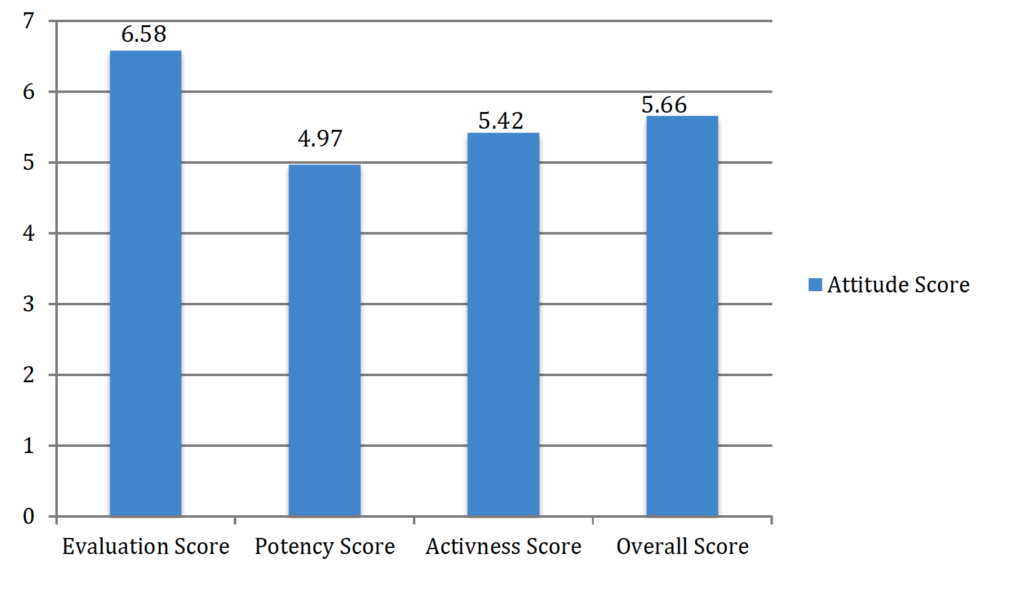
Figure 1. Mean camper attitude scores by construct.
The possible score range was 1.00 – 7.00. A score falling between 1.00 and 3.99 indicated a negative attitude. A mean score between 4.00 and 4.99 was considered a neutral attitude. And, finally, a mean score between 5.00 and 7.00 indicated a positive attitude (Osgood et al., 1965). As displayed in Table 2, campers’ overall attitude toward camp was positive (M = 5.66; SD = 0.45). When comparing the three attitude constructs, they were most positive regarding their evaluative attitude of camp (M = 6.58; SD = 0.53), followed by their attitude related to the activeness of camp (M = 5.42; SD = 0.62). Camper attitude related to the potency of camp (M = 4.97; SD = 0.65) was neutral (see Table 2).
Table 2
Mean Camper Attitude Scores (n = 344)
| Type of Attitude | n | Ma | SD |
|---|---|---|---|
| Attitude Related to Evaluation of Camp | 344 | 6.58 | 0.53 |
| Attitude Related to Potency of Camp | 344 | 4.97 | 0.65 |
| Attitude Related to Activeness of Camp | 344 | 5.42 | 0.62 |
| Overall Attitude of Camp | 344 | 5.66 | 0.45 |
Findings Associated with Objective Two
Table 3 displays that no statistically significant relationship existed r(342) = .01, p = .83 between camper evaluation of camp attitude scores and content examination scores. Data do, however, reveal that camper content examination scores were statistically significantly correlated to camper attitude scores when measuring the potency of camp r(342) = .11, p = .04. According to Cohen (1988) an r = .11 is a small effect size. No statistically significant relationship existed between camper attitude scores associated with activeness of camp and camper content examination scores r(342) = .07, p = .20. Further, no statistically significant relationship existed between campers’ total attitude toward camp score and their content examination score r(342) = .09, p = .10 (see Table 3).
Table 3
Correlation Between Camper Attitude Scores and Content Examination Scores (n = 344)
| Camper Exam Score | |
| Evaluation of Camp | .01 |
| Potency of Camp | .11* |
| Activeness of Camp | .07 |
| Overall Attitude Toward Camp | .09 |
Findings Associated with Objective Three
Table 4 shows that no statistically significant relationship existed between campers’ evaluative attitude of camp score and delayed content examination score r(241) = -.06, p = .33. Data also reveal that campers’ delayed content examination scores are not statistically significantly correlated to campers’ potency attitude of camp scores r(241) = .06, p = .32. No statistically significant relationship existed between campers’ activeness attitude of camp scores and campers’ delayed content examination scores r(241) = .09, p = .16. Further, no statistically significant relationship existed r(241) = .05, p = .45 between campers’ overall attitude toward camp score and delayed content examination score (see Table 4).
Table 4
Correlation Between Camper Attitude Scores and Delayed Content Examination Scores (n = 243)
| Camper Exam Score | |
| Evaluation of Camp | -.06 |
| Potency of Camp | .06 |
| Activeness of Camp | .09 |
| Overall Attitude Toward Camp | .05 |
Findings Associated with Objective Four
The fourth objective was to determine the relationship between selected personal characteristics (i.e., sex, race, age, grade level, socioeconomic status, years of camp attendance, chapter FFA officer status, and grade point average) and attitudes of participants regarding the overall camp experience. Socioeconomic status (SES) was determined by asking campers if they received free or reduced lunches at school, a practice accepted widely in academic literature to distinguish levels of SES (Caldas & Bankson, 1997; Molnar et al., 1999; Nye, Konstantopoulos, & Hedges, 2004). We chose to report only statistically significant findings. No statistically significant relationships were detected between attitude scores and sex, race, SES, chapter officer status, or GPA.
Table 5 displays data showing that no statistically significant relationship was found between campers’ age and evaluative attitude score r(344) = .03, p = .59. A statistically significant correlation was found between campers’ age and potency attitude r(344) = .15, p = .00. According to Cohen (1988) an r = .15 is a small effect size. No statistically significant relationship was detected between campers’ age and activeness attitude mean score r(344) = .09, p = .11. However, a statistically significant relationship did exist between campers’ age and their overall mean attitude score (see Table 5), which also resulted in a small effect (Cohen, 1988).
Table 5
Correlation Between Camper Age and Attitude Scores (n = 344)
| Camper Age | |
| Evaluation of Camp | .03 |
| Potency of Camp | .15* |
| Activeness of Camp | .09 |
| Overall Attitude Toward Camp | .12* |
There were no statistically significant differences between campers’ evaluative attitude scores F(4, 343) = 1.00, p = .41 or activeness attitude scores F(4, 343) = 2.18, p = .07 by grade level (see Table 6). As displayed in Table 6, there was a statistically significant difference between campers’ potency attitude scores when compared by grade level. The analysis resulted in an effect size of ηp2 = .04, indicating that 4% of the variance can be attributed to camper grade level. A post hoc pairwise analysis revealed that ninth grade campers had a statistically significantly lower potency attitude score than did twelfth grade campers (see Table 6).
Table 6
Comparative Analysis of Camper Potency Attitude Scores by Grade Level (n = 344)
| SS | df | MS | F | p | |
| Between-Groups | 5.86 | 4 | 1.47 | 3.62 | .01 |
| Within-Groups | 137.20 | 339 | .41 | ||
| Total | 143.06 | 343 |
Table 7 shows there was a statistically significant difference between camper’s overall attitude scores by grade level. The analysis produced an effect size of ηp2 = .04, indicating 4% of the variance can be attributed to grade level. A post hoc pairwise analysis revealed that ninth grade campers have a statistically significantly lower overall attitude score than twelfth grade campers (see Table 7).
Table 7
Comparative Analysis of Camper Overall Attitude Scores by Grade Level (n = 344)
| SS | df | MS | F | p | |
| Between-Groups | 2.68 | 4 | .67 | 3.41 | .01 |
| Within-Groups | 66.66 | 339 | .20 | ||
| Total | 69.33 | 343 |
When comparing mean attitude scores by years of camp attendance, we found no statistically significant differences between campers’ mean evaluative attitude scores when compared by years of camp attendance F(4, 343) = 1.70, p = .15. We found, however, differences in potency attitude scores when compared by years of camp attendance. This analysis resulted in an effect size of ηp2 = .07, signifying 7% of the variance in potency attitude scores can be attributed to years of camp attendance (see Table 8). A post hoc, pairwise analysis revealed campers’ who were participating in camp for the third or fourth time had a statistically significantly higher potency attitude score than campers who were attending for the first time (see Table 8).
Table 8
Comparative Analysis of Camper Potency Attitude Scores by Years of Camp Attendance (n = 344)
| SS | df | MS | F | p | |
| Between-Groups | 9.85 | 4 | 2.46 | 6.27 | .00 |
| Within-Groups | 133.21 | 339 | .39 | ||
| Total | 143.06 | 343 |
Table 9 shows data indicating a statistically significant difference between campers’ activeness attitude scores when compared by years of camp attendance. The analysis produced an effect size of ηp2 = .09, meaning 9% of the variance in activeness attitude scores can be attributed to years of camp attendance. A pairwise analysis indicated campers who were attending camp the third time produced a statistically significantly higher activeness attitude score than those campers who are attending for the first or second time (see Table 9).
Table 9
Comparative Analysis of Camper Activeness Attitude Scores by Years of Camp Attendance (n = 344)
| SS | df | MS | F | p | |
| Between-Groups | 12.34 | 4 | 3.09 | 8.80 | .00 |
| Within-Groups | 118.94 | 339 | .35 | ||
| Total | 131.28 | 343 |
Finally, we found statistically significant differences in campers’ overall attitude scores when compared by years of camp attendance (see Table 10). Analysis resulted in an effect size of ηp2 = .09, indicating that 9% of the variance in overall attitude scores can be attributed to years of camp experience. A post hoc, pairwise analysis revealed campers attending camp the third time had a significantly higher overall attitude score than those campers who were attending for the first or second time (see Table 10).
Table 10
Comparative Analysis of Camper Overall Attitude Scores by Years of Camp Attendance (n = 344)
| SS | df | MS | F | p | |
| Between-Groups | 6.34 | 4 | 1.58 | 8.53 | .00 |
| Within-Groups | 62.97 | 339 | .19 | ||
| Total | 69.33 | 343 |
Conclusions, Implications, and Recommendations
Overall, campers have a positive attitude toward the overall camp experience. Two of the three construct scores were greater than 5.00, indicating campers have a positive attitude regarding their evaluation of the camp and the activeness of the camp experience. The lowest attitude score was associated with the potency of camp. The mean of 4.97 indicates that campers’ attitudes were indifferent regarding the potency of the camp experience. Do campers not recognize the need to learn the planned academic curriculum? Campers’ indifferent potency attitude suggests they were not challenged by the learning goals at camp.
Findings of this study lead to the conclusion there is no statistically significant relationship between attitude and learning of the curriculum taught. Further, there is no relationship between campers’ attitudes at camp and what they remember from the camp experience six months later. This conclusion refutes previous research indicating the presence of a relationship between the affective and cognitive learning domains (Boyle et al., 2007; Cochran, et al., 2010; Hortwitz et al., 1986; Onwuegbuzie et al., 2000) and supports the notion that attitude is one of many factors impacting a person’s behavior (Ajzen & Fishbein, 1977). Therefore, what is the purpose of FFA Leadership Camp? The implication is that FFA Leadership Camp exists as a fun event that students enjoy. However, perhaps it is not the venue for significant learning of content.
Campers attending for the third year have more positive attitudes about camp than those who are attending for the first or second time. Do students with less camp experience exhibit lower attitude scores due to anxiety or even fear? Do previous experiences with camp – building on familiarity – lead to better attitudes? According to attitude theory (Breckler & Wiggins, 1989a), attitudes are shared in a group and are properties of both the individual and the group. We recommend camp planners consider informally organizing events that allow campers to group by years of camp experience and engage in activities appropriate for their comfort level. For example, more experienced students could engage in a high ropes course while first year students learn the foundations of trust by completing a low ropes course. We predict such practices would increase the attitude scores of both experienced and non-experienced campers.
What are the implications of these results for FFA camp planners? Conclusions of this study and previous research noting negligible knowledge retention from this camp (Brown & Terry, 2013) question the value of using a significant component of an FFA summer camp to teach academic leadership content. FFA summer camp, where the more formal structure of school is exchanged for an outdoor, short-term, physically active environment, may not be conducive for such a component. Further, the emphasis and expectations of students may be more focused on meeting new people, socializing, and having fun than learning a curriculum. Finally, qualitative phenomenological research focused on discovering the essence of the lived experiences of FFA summer campers is warranted.
Further research is warranted to determine if our results are tenable over time; however, if they are, we recommend that camp planners discontinue the use of academically structured learning material during small group sessions. This recommendation is supported by the traditional concentration of FFA summer camps that taught leadership concepts in the context of outdoor activities focused on the environment, conservation, and recreation (Connors et al., 2010).
References
Ajzen, I., & Fishbein, M. (1977). Attitude-behavior relations: A theoretical analysis and review of empirical research. Psychological Bulletin, 84(5), 888–918. Retrieved from http://web.ffos.hr/oziz/tam/Ajzen_1977.pdf
American Camp Association. Retrieved from http://www.acacamps.org
Berti, A. E., & Andriolo, A. (2001). Third graders’ understanding of core political concepts (law, nation-state, government) before and after teaching. Genetic, Social, and General Psychology Monographs, 127(4), 346–377.
Bialeschki, M. D., Henderson, K. A., & James, P. A. (2007). Camp experiences and developmental outcomes for youth. Child and Adolescent Psychiatric Clinics of North America, 16(4), 769–788. doi:10.1016/j.chc.2007.05.011
Biggs, J. (1999). What the student does: Teaching for enhanced learning. Higher Education Research and Development, 18(1), 57–75. doi:10.1080/0729436990180105
Boyle, A., Maguire, S., Martin, A., Milson, C., Nash, R., Rawlinson, S., Turner, A., Wurthmann, S., & Conchie, S. (2007). Fieldwork is good: The student perception and the affective domain. Journal of Geography in Higher Education, 31(2), 299–317. doi:10.1080/03098260601063628
Breckler, S. J., & Wiggins, E. C. (1989a). On defining attitude and attitude theory: Attitude, structure, and function. Retrieved from http://books.google.com/books?hl=en&lr=&id=DPXes4FwtngC&oi=fnd&pg=PA407&dq=attitude+theory&ots=VolvUhZBYO&sig=01jSbAkdE1RR0GwJPL6bq_lIcvc#v=onep age&q=attitude%20theory&f=false
Breckler, S. J., & Wiggins, E. C. (1989b). Affect versus evaluation in the structure of attitudes. Journal of Experimental Social Psychology, 25(3), 253–271. doi.org/10.1016/0022- 1031(89)90022-X
Brown, N. R., & Terry, Jr. R. (2013). The effects of group leader learning style on student knowledge gain in a leadership camp setting: A repeated-measures experiment. Journal of Agricultural Education, 54(2), 44–56. doi:10.5032/jae.2013.02044
Brown, N. R., Terry, Jr. R., & Kelsey, K. D. (2013). An examination of student learning outcomes and knowledge retention at FFA summer camp. Proceedings of the National Agricultural Education Research Conference, Columbus, OH, 40, 561–578.
Caldas, S. J., & Bankston, C. III. (1997). Effect of school population socioeconomic status on individual academic achievement. The Journal of Educational Research, 90(5), 269–277. doi:10.1080/00220671.1997.10544583
Chen, P. Y., & Popvich, P. M. (2002). Correlation: Parametric and nonparametric measures. Thousands Oaks, CA: Sage Publications.
Cochran, J. L., McCallum, R. S., & Bell, S. M. (2010). Three A’s: How do attributions, attitudes, and aptitude contribute to foreign language learning? Foreign Language Annals, 43(4), 566–582. doi:10.1111/j.1944-9720.2010.01102.x
Cohen, J. (1988). Statistical power analysis for the behavioral sciences (2nd ed.). Hillsdale, NJ: Lawrence Erlbaum.
Connors, J. J., Falk, J. M., & Epps, R. B. (2010). Recounting the legacy: The history of use of FFA camps for leadership and recreation. Journal of Agricultural Education, 51(1), 32– 42. doi:10.5032/jae.2010.01032
Creswell, J. W. (2008). Educational research: Planning, conducting, and evaluating quantitative and qualitative research. Upper Saddle River, NJ: Pearson Education, Inc.
Cronbach, L. J. (1970). Essentials of psychological testing (3rd ed.). New York, NY: Harper & Row.
Dillman, D. A. (2000). Mail and internet survey’s: The tailored design method. New York, NY: John Wiley & Sons, Inc.
Doerfert, D. L. (Ed.) (2011). National research agenda: American Association for Agricultural Education’s research priority areas for 2011-2015. Lubbock, TX: Texas Tech University, Department of Agricultural Education and Communications.
Ferrari, T. M., & McNeely, N. N. (2007). Positive youth development: What’s camp counseling got to do with it? Findings from a study of Ohio 4-H camp counselors. Journal of Extension, 45(2). Retrieved from http://www.joe.org/joe/2007april/rb7p.shtml
Field, A. (2009). Discovering statistics using SPSS. Los Angeles, CA: Sage.
Fleming, V. M., & Alexander, J. M. (2001). The benefits of peer collaboration: A replication with a delayed posttest. Contemporary Educational Psychology, 26, 588–601. doi:10.1006/ceps.2001.1082
Funk, D. C., Haugtvedt, C. P., & Howard, D. R. (2000). Contemporary attitude theory in sport: Theoretical considerations and implications. Sport Management Review, 3(2), 125–144. doi.org/10.1016/S1441-3523(00)70082-9
Gagne, R. M. (1984). Learning outcomes and their effects: Useful categories of human performance. American Psychologist, 39(4), 377–385.
Garst, B. A., & Johnson, J. (2005). Adolescent leadership skill development through residential 4-H camp counseling. Journal of Extension, 43(5). Retrieved from http://www.joe.org/joe/2005october/rb5.php
Hall, V. C., & Edmondson, B. (1992). Relative importance of aptitude and prior domain knowledge on immediate and delayed posttests. Journal of Education Psychology, 84(2), 219–223. doi:10.1037/0022-0663.84.2.219
Henderson, K. A., Bialeschki, M. D., & James, P. A. (2007). Overview of camp research. Child and Adolescent Psychiatric Clinics of North America, 16(4), 755–767. doi:10.1016/j.chc.2007.05.010
Hoover, T. S., Scholl, J. F., Dunigan, A. D., & Mamontova, N. (2007). A historical review of leadership development in the FFA and 4-H. Journal of Agricultural Education, 48(3), 100–110. doi:10.5032/jae.2007.03100
Horwitz, E., Horwitz, M., & Cope, J. (1986). Foreign language classroom anxiety. Modern Language Journal, 70(2), 125–132. doi:10.1111j.1540-4781.1986.tb05256.x
Isaac, S., & Michael, W. B. (1995). Handbook in research and evaluation: A collection of principles, methods, and strategies useful in the planning, design, and evaluation of studies in education and the behavioral sciences. San Diego, CA: EdITS Publishers.
Kane, M. T. (1986). The role of reliability in criterion-referenced tests. Journal of Educational Measurement, 23(3), 221–224. doi:10.1111/j.1745-3984.1986.tb00247.x
Kelman, H. C. (2007). The Israeli-Palestinian peace process and its vicissitudes: Insights from attitude theory. American Psychologist, 62(4), 287–303. doi:10.1037/0003- 066X.62.4.287
Kirk, R. E. (1995). Experimental design. Pacific Grove, CA: Brooks/Cole Publishing Company.
Kraiger, K., Ford, J. K., & Salas, E. (1993). Application of cognitive, skill-based, and affective theories of learning outcomes to new methods of training evaluation. Journal of Applied Psychology, 78(2), 311–328. Retrieved from http://www.owlnet.rice.edu/~antonvillado/courses/12a_psyc630001/Kraiger,%20Ford,%20&%20Salas%20(1993)%20JAP.pdf
Krejcie, R. V., & Morgan, D. W. (1970). Determining sample size for research activities. Educational and Psychological Measurement, 30(3), 607–610. doi:10.1177/001316447003000308.
Krosnick, J. A., & Abelson, R. P. (1992). The case for measuring attitude strength in surveys. Questions About Questions: Inquiries into the Cognitive Bases of Surveys. New York, NY: Russell Sage Foundation.
Larson, R. W. (2000). Toward a psychology of positive youth development. American Psychologist, 55(1), 170–183. doi:10.1037//0003-066X.55.1.170
Lindner, J. R., Murphy, T. H., & Briers, G. E. (2001). Handling nonresponse in social science research. Journal of Agricultural Education, 42(4), 43–53. doi:10.5032/jae.2001.04043
Molnar, A., Smith, P., Zahorik, J., Palmer, A. Halbach, A., & Ehrle, K. (1999). Evaluating the SAGE program: A pilot program in targeted pupil-teacher reduction in Wisconsin. Educational Evaluation and Policy Analysis, 21(2), 165–177. doi:10.3102/01623737021002165
Nye, B., Konstantopoulos, S., & Hedges, L. V. (2004). How large are teacher effects? Educational Evaluation and Policy Analysis, 26(3), 237–257. doi:10.3102/01623737026003237
Onwuegbuzie, A. J., Bailey, P., & Daley, C. E. (2000). Cognitive, affective, personality, and demographic predictors of foreign-language achievement. Journal of Educational Research, 94(1), 3–15. doi:10.1080/00220670009598738
Osgood C. E., Suci, G. J., & Tannenbaum, P. H. (1965). The measurement of meaning. Urbana, IL: University of Illinois Press.
Phillips, E. M. (1992). The effects of language anxiety on students’ oral test performance and attitudes. The Modern Language Journal, 76(1), 14–26. Retrieved from http://www.jstor.org/stable/329894
Raden, D. (1985). Strength-related attitude dimensions. Social Psychology Quarterly, 48(4), 312–330. Retrieved from http://www.jstor.org/stable/2786693
Shih, C.-C.& Gamon, J. (2001). Web-based learning: Relationships among student motivation, attitude, learning styles, and achievement. Journal of Agricultural Education, 42(4), 12– 20. doi:10.5032/jae.04012
Thurber, C. A., Scanlin, M. M., Scheuler, L., & Henderson, K. A. (2007). Youth development outcomes of the camp experience: Evidence for multidimensional growth. Journal of Youth Adolescence, 36(3), 241–254. doi:10.1007/s10964-006-9142-6
Wingenbach, G. J., & Kahler, A. A. (1997). Self-perceived youth leadership and life skills of Iowa FFA members. Journal of Agricultural Education, 38(3), 18–27. doi:10.5032/jae.1997.03018