Erica B. Thieman, University of Illinois
William A. Bird, School Principal, Tennessee
Stacy K. Vincent, University of Kentucky, Stacy.vincent@uky.edu
Robert Terry, Jr., Oklahoma State University
Abstract
The purpose of this descriptive-correlation study was to describe and identify the differences between high performers and low performers among participants in the Missouri FFA Livestock Evaluation Career Development Event. The variables of interest included: marital status of parents, Free/reduced lunch status, Individual Education Plan (IEP) status, academic grade level, cumulative grade point average, and previous Career Development Event (CDE) experience as factors related to the individual’s performance. Characteristics investigated in this study were determined from a review of related literature on student achievement. This research detected differences between the demographic characteristics of the high performing participants and low performing participants including: IEP status, grade level, free/reduced lunch status, grade point average, marital status of guardian(s), previous experience in livestock evaluation, and gender. Recommendations include increased professional development in accommodating all learners, reinforcement of the purpose of CDEs, and an analysis of other CDE areas.
Introduction
The mission of the National FFA Organization is, “FFA makes a positive difference in the lives of students by developing their potential for premier leadership, personal growth and career success through agricultural education” (National FFA Organization, 2009, p. 5). This mission is accomplished through three components of agricultural education: classroom/laboratory instruction, supervised agricultural experience, and the National FFA Organization (National FFA Organization, 2009). The amount of time school-based agriculture teachers dedicate to each of these areas varies by program (Phipps, Osborne, Dyer, and Ball, 2008). Each component, however, is considered to be equally important to the success of students enrolled in agricultural education courses (Phipps, et al., 2008).
Ideally, agricultural education introduces all students to the opportunities provided by the three components of agricultural education and prepares each student for a career in the agriculture industry (National FFA Organization, 2009). Chiasson and Burnett (2001) stated that “agriculture programs educate students to achieve in diverse areas that are very practical for dealing with the challenges in today’s world” (p. 62). The end result is a student with enhanced knowledge in agriculture, leadership abilities, and direction toward a chosen career of interest (National FFA Organization, 2009). There are approximately 800,000 students enrolled in more than 100 different agricultural education courses in the United States (National FFA Organization, 2009). As Morgan, Chelewski, Lee, and Wilson (1998) stated, this curriculum is intended to prepare students of all levels and backgrounds for future careers in agriculture and related fields.
Involvement in the National FFA organization is intended to provide real world learning opportunities outside the classroom for all agricultural education students (Talbert & Balschweid, 2005). According to Reis and Kahler (2007), students identified the FFA and Career Development Events (CDEs) offered through FFA to be the most satisfying experiences while they were involved in school-based agricultural education courses. The first CDEs, originally referred to as “evaluation contests,” can be traced to state contests for vocational agriculture students held in 1919 (Tenney, 1977). These organized competitions were designed for students to compete using knowledge of specific areas of agriculture attained from instruction. According to the Missouri FFA Career Development Event Handbook (Missouri FFA Association, 2008), CDEs aid and enhance student interest in the agricultural industry. CDEs are designed to, “motivate students to acquire additional knowledge, develop skills and abilities, and stimulate student interest in furthering their education” (Missouri FFA Association, 2008, p. 1). CDEs are also designed to “assess the level of proficiency each student has achieved” in specific subject areas taught in secondary agriculture classroom settings (Missouri FFA Association, 2008, p. 1). As such, CDEs are linked to instruction and relate to all students enrolled in agriculture classes. This assertion suggests that the purpose of CDEs has expanded since their adoption by the National FFA Organization.
Based upon literature, the purpose of agricultural education is to prepare all students for entry into the agriculture industry (Association for Career and Technical Education, 2010; Missouri Department of Elementary and Secondary Education, 2009; National FFA Organization, 2009; Phipps, et al., 2008). If agricultural educators truly believe in its purposes, as defined by these authorities, then it can be assumed that all students, regardless of their individual differences, are provided the opportunity to participate and can find success in these areas of agricultural education, FFA, and CDEs. However, there are varying factors among students that can affect the likelihood of student achievement (U.S. Department of Education, 2009). These varying student demographics can include previous experience in the subject area, parent marital status, low socioeconomic status, and the ability level of the student to learn and apply information (Gohm, Oishi, Darlington, & Diener, 1998; Kopcha & Sullivan, 2008; Okpala, 2002; Rumburger & Palardy, 2005). According to the National Research Council (2000), it is crucial to student success that teachers address student diversity when providing instruction, allowing all students the opportunity to achieve success inside and outside the classroom.
Research has been conducted to determine diversity among FFA members participating at state and national CDEs (England, 1996; Johnson, 1991; Rayfield, 2006; Rayfield, Fraze, Brashears, & Lawver, 2007). Research concerning characteristics of students participating at state qualifying CDEs is limited. Furthermore, little research exists explaining characteristics of low performing students in CDEs. This study seeks to expand knowledge about the role CDEs have in accomplishing the FFA mission by comparing characteristics of high achieving students and low achieving students participating in state qualifying CDEs.
Theoretical Framework
The theoretical model for this research is derived from the attribution theory of achievement established by Weiner et al., (1971), and is based on causal factors and individual differences. Causal factors for student achievement, identified by Weiner, include students’ ability, the level of effort put forth, the difficulty of the task at hand, forms of support, and luck (Schunk, 2004). In most cases, only one or two of these factors are identified as being primarily responsible for the outcome (Weiner et al., 1971). These descriptors can contribute to or restrict the likelihood of student success unless they can be recognized and managed by the student, parent, or teacher (Schunk, 2004).
Weiner et al. (1971) organized causal factors into three causal dimensions. The dimensions and categories for causal factors are: a) internal or external to the student; b) stable or unstable over time; and c) controllable or uncontrollable by the student (Weiner, 1979). Figure 1 displays a conceptualization of this theory.
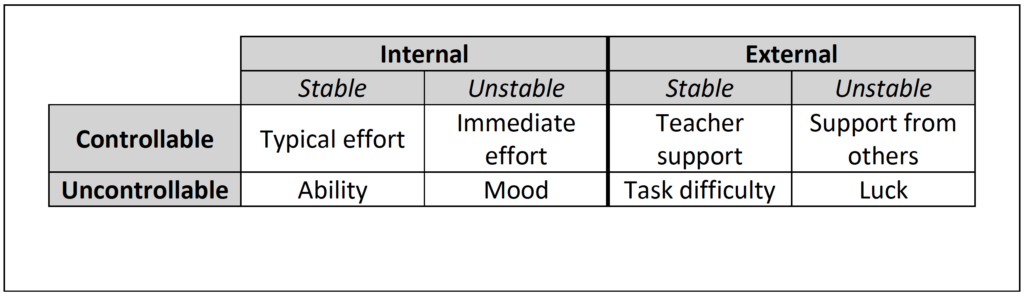
Figure 1. Model of Causal Attribution displaying the interactions between the dimensions by Weiner, B., Frieze, I. H., Kukla, A., Reed, L., Rest, S., & Rosenbaum, R. M. (1971).
The framework design in Figure 1 highlights the relationships of attributes commonly possessed by students (Schunk, 2004). The attributes described occur in varying situations and degrees (Schunk, 2004). Various combinations of these attributes can increase or decrease the likelihood of student success (Weiner, 1979). Success is influenced by level of stability perceived by students in internal and external variables but controllability of attributes does not necessarily determine success (Schunk, 2004).
Individual differences, such as previous experiences, sex, parental relationships, and socioeconomic status, are considered to contribute to the success or failure of students (Schunk, 2004). Schunk (2004) stated that previous experiences can play a role in student motivation as well as their level of aspiration. This assertion is congruent with the findings of England (1996), Johnson (1991), Rayfield (2006), and Rayfield, et al. (2007). Sex and student achievement are correlated based on subject area and age of students (Rayfield, 2006; Rayfield, et al., 2007; Thomas & Stockton, 2003). Sutton and Soderstrom (1999) found an inverse relationship between socioeconomic status and student achievement. Bokhorst, Sumter, and Westenberg (2009) stated that the relationship between parents and 9 to 18 year old youths, or lack thereof, can contribute to student self-efficacy. Applied to the agricultural education context, can these causal factors and individual differences contribute to the performance of students in the Livestock Evaluation CDEs?
Purpose/Objectives
The purpose of this study was to determine the demographic characteristics including IEP status, cumulative GPA, previous experience in livestock evaluation, free/reduced lunch, guardian marital status, and sex of student of selected students who participated in the Missouri FFA Livestock Evaluation CDE in 2009. Specifically, this research compared selected characteristics of participants who performed poorly in this activity to those of participants who performed exceptionally well. The following three research objectives were formulated to accomplish the purpose:
- What are the selected demographic characteristics of students who scored among the highest 2.5% at the state finals of the Missouri Livestock Evaluation CDE in 2009?
- What are the selected demographic characteristics of the students who scored among the lowest 2.5% (lowest performing) at district Missouri Livestock Evaluation CDEs in 2009?
- What are the differences between selected demographic characteristics of the highest performing students and lowest performing students in the Missouri Livestock Evaluation CDE in 2009?
Methods/Procedures
This study was a descriptive-correlation research design. The purposive sample was composed of the top and bottom 2.5% of all participating competitors in the 2009 Missouri FFA Livestock Evaluation CDE (n = 32). The lowest performers (LP) were identified based upon scores earned by individuals at each of the six district events, which serve as the qualifying round for the state CDE finals. The highest performers (HP) where identified based upon scored earned by individuals at the state CDE finals. All subjects were identified from official results of district and state CDEs posted on JudgingCard.com. Data were collected from the FFA Advisor each subject selected for the study.
The Missouri FFA Livestock Evaluation CDE is divided into three subject matter areas that contribute to a total possible individual score of 550. Individuals competing in the Missouri FFA Livestock Evaluation CDE (N = 640) in 2009 had a mean score of 423.91 (SD = 41.83). The highest performers group was composed of students who scored 2.00 SD above the mean (n = 16; 2.5%). The lowest performers group was composed of students who scored 2.00 SD below the mean (n = 16; 2.5%). It is evident that differences exist in these students’ scores. However, it is not assumed that a difference exists in the students characteristics.
The researchers contacted the subjects’ FFA Advisors through personal or telephone contact following the state CDE finals. Each Advisor was asked to provide information about 18 characteristics included in this investigation through an interview administered by a single person who served as the data collector. These items were derived through the findings of research addressing factors of achievement among high school students (Johnson, 1991; Rayfield, 2006; Rayfield, et al., 2007). A panel of experts (n = 5), composed of former school- based agriculture teachers and FFA advisors, examined the items for content validity. Because data collection was conducted through interviews, there was no need to establish face validity. Because this study only utilized nominal data, it was unnecessary to conduct a pilot study to establish reliability (Ary, Jacobs, Razavieh, & Sorensen, 2006).
Following the data collection period, data were coded and entered into SPSS for Windows. Descriptive statistics of central tendency and variability were calculated to summarize the data. Independent sample t-tests, Cohen’s d, and phi correlations were conducted to test differences between the groups, and binary logistic regression was computed to explain the variance in individual characteristics. Effect sizes were calculated and interpreted using Cohen’s (1988) d coefficients: negligible effect size (d < 0.15, small effect size (d < 0.40), medium effect size (d < 0.75), large effect size (d < 1.10), very large effect size (d < 1.45), and huge effect size (d > 1.45). Phi effect sizes were calculated and are described as: .10 – .29 = weak, .30 – .49 = moderate, .50 and above = strong (Huck, 2008). An alpha level of .05 was established a priori for tests of significance.
Results/Findings
Objective One
Objective One sought to describe selected demographic characteristics of the students who were among the top 2.5% of participants in the 2009 Missouri Livestock Evaluation CDE. In this group, juniors (n = 7; 43.75%) and seniors (n = 6; 37.50%) outnumbered freshmen (n = 1; 6.25%) and sophomores (n = 2; 12.5%). No students in the HP group had an IEP. Only 1 (6.25%) of the 16 students in this group qualified for free/reduced lunch. None of the subjects had a grade point average (GPA) below a 3.00 on a 4.00 scale. Eight (50%) had a GPA of 3.00 – 3.99 and 6 (37.50%) had a GPA of 4.00 or better. The mean GPA for the HP was 3.72 (n = 14). Marital status of guardian(s) was categorized as either married or single and/or divorced. All but two (n = 14; 87.50%) of the parents of HP were married. More than 40% (n = 7; 43.75%) of the HP had previous evaluating livestock experience. Table 1 shows a summary of these data.
Objective Two
The goal of Objective Two was to describe the selected demographics of the students who were among the lowest 2.5% of the Missouri Livestock Evaluation CDE. The majority of the students in this group were freshmen (n = 10; 62.50%) with the remainder being composed of 2 sophomores (12.50%), 2 juniors (12.50%) and 2 seniors (12.50%). Nearly half the LP subjects were reported to have an IEP (n = 7; 43.75%) with one student having an unknown status. Seven of the LP subjects were reported to receive free/reduced lunch (43.75%) while 5 (31.25%) were reported to not receive free/reduced lunch, and the status of 4 (25.00%) students was unknown. None of the students in the LP category had a GPA of 4.0 or above with two responses being unusable. The mean GPA for students in the LP category was 2.55. The marital status of guardian(s) of LP students was split evenly between the categories of married (50.00%) and single/divorced (50.00%). Only one LP student (6.25%) had previous experience in the Livestock Evaluation CDE. These data are also displayed in Table 1.
Table 1
Characteristics of Highest Performing (HP) Participants and Lowest Performing (LP)  Participants in the Missouri Livestock Evaluation CDE (n = 32)
| Characteristic | HP (n = 16) | LP (n = 16) | Total (n = 32) | |||
|---|---|---|---|---|---|---|
| f | % | f | % | f | % | |
| Grade | ||||||
| Freshman | 1 | 6.25 | 10 | 62.50 | 11 | 34.28 |
| Sophomore | 2 | 12.50 | 2 | 12.50 | 4 | 12.50 |
| Junior | 7 | 43.75 | 2 | 12.50 | 9 | 28.13 |
| Senior | 6 | 37.50 | 2 | 12.50 | 8 | 25.00 |
| GPA | ||||||
| 4.0 and Above | 6 | 37.50 | 0 | 0.00 | 6 | 18.75 |
| 3.0-3.99 | 8 | 50.00 | 6 | 37.50 | 14 | 43.75 |
| 2.0-2.99 | 0 | 0.00 | 6 | 37.50 | 6 | 18.75 |
| 2.0 and Below | 0 | 0.00 | 2 | 12.50 | 2 | 6.25 |
| Sex | ||||||
| Female | 3 | 18.80 | 5 | 31.30 | 8 | 25.00 |
| Male | 13 | 81.30 | 11 | 68.80 | 24 | 75.00 |
| IEP Status | ||||||
| No | 16 | 100.00 | 8 | 50.00 | 24 | 75.00 |
| Yes | 0 | 0.00 | 7 | 43.75 | 7 | 21.88 |
| Recipient of Free/Reduced Lunch | ||||||
| No | 15 | 93.75 | 7 | 43.75 | 22 | 68.75 |
| Yes | 1 | 6.25 | 5 | 31.25 | 6 | 18.75 |
| Marital Status of Guardian(s) | ||||||
| Married | 14 | 87.50 | 8 | 50.00 | 22 | 68.75 |
| Single and/or Divorced | 2 | 12.50 | 7 | 43.75 | 9 | 28.13 |
| Previous Experience in Livestock | ||||||
| No | 9 | 56.25 | 15 | 93.75 | 24 | 75.00 |
| Yes | 7 | 43.75 | 1 | 6.25 | 8 | 25.00 |
Objective 3
The purpose of Objective Three was to compare differences between HP group and LP group in the Missouri Livestock Evaluation CDE. A phi coefficient was utilized to estimate the degree of correlation between the selected demographic variables (IEP status, cumulative GPA, previous experience in the Livestock Evaluation CDE, free/reduced lunch, guardian marital status, and sex of student) and student performance. Phi was chosen because the variables are dichotomous and nominal in nature and it is a measure of the degree of association between the variables (Huck, 2008). Pearson product-moment correlation coefficient (rf) was used for correlation analysis. IEP Status was the only variable that identified a strong effect size (rf = .56). Variables having moderate effect sizes to contestant achievement included: Previous experience in the Livestock Evaluation CDE (rf = .43), free/reduced lunch (rf = .43), and guardian marital status (rf = .38). Sex was found to have a weak effect size (rf = .14) to student performance in the CDE. See Table 2 for phi coefficient values.
Table 2
Comparison of Student Characteristics Between Highest Performers and Lowest Performers in the Missouri FFA Livestock Evaluation CDE (n = 32)
| Variable | rφ | r2 | Effect Sizea |
|---|---|---|---|
| IEP Status | .56 | .31 | Strong |
| Previous Experience | .43 | .18 | Moderate |
| Free/Reduced Lunch | .43 | .18 | Moderate |
| Guardian Marital Status | .38 | .14 | Moderate |
| Sex of Student | .14 | .02 | Weak |
An independent (two-tailed) t-test detected a difference, t(26) = 3.99; p = .02] in the GPA of the HP group (M = 3.72; SD = .32) and LP group (M = 2.55; SD = .64). It should be noted that four scores, two from each of the HP and LP categories, were deemed unusable. Cohen’s d was calculated (d = 2.31) and using Cohen’s descriptors a “Large” effect size (Cohen, 1988) was noted (see Table 3).
Table 3
Difference in Raw Grade Point Average of Highest Performers versus LowestPerformer (n = 28)
| Category | n | M | SD | Cohen’s d |
|---|---|---|---|---|
| Highest Performers | 14 | 3.72 | 0.32 | |
| 2.31 (Largea) | ||||
| Lowest Performers | 14 | 2.55 | 0.64 |
Conclusions
Results of this study indicate that there are certain demographic characteristics that will portend students’ achievement level in the Livestock Evaluation CDE in Missouri. These results are consistent with the findings from several previous studies about FFA member achievement (England, 1996; Johnson, 1991; Rayfield, 2006; Rayfield, et al., 2007). However, the findings of this study contradict results of certain factors affecting student achievement (Thomas & Stockton, 2003; Webster, Young, & Fisher, 1999). A previous study found that males scored higher on the National Livestock Evaluation CDE (Rayfield, 2006; Rayfield, et al., 2007). This study did not find a substantial relationship between sex and achievement. A profile of highest performers in the 2009 Livestock Evaluation CDE in Missouri can be concluded from these data. Highest performers were predominately upperclassmen with above a B grade point average in school and did not require specialized education services. Their families had two parents in the household and they were not in the lower socioeconomic status bracket as indicated by free/reduced lunch. These students also had previous experience with the Livestock Evaluation CDE.
Similarly, a profile can be constructed of lowest performers in the Missouri Livestock Evaluation CDE. They were underclassmen with a C average GPA. Compared to highest performers, it was more likely that lowest performers required specialized education services. It was more likely that lowest performers qualified for free/reduced lunch, indicating their guardians earned less than $41,000 (Child Nutrition Programs, 2009) per year for a family of four. These students were also more likely to come from a home with a single parent. It is unlikely that lowest achievers had previous experience with the Livestock Evaluation CDE.
Implications/Recommendations
The conclusion of this study regarding the impact of prior livestock evaluation experience correlating to success in Livestock Evaluation CDEs were in agreement with findings by Rayfield (2006), Rayfield, et al. (2007), and England (1996). The influence of sex regarding CDE achievement varies among different studies. Contradictory to previous studies (Thomas & Stockton, 2003; Rayfield, 2006; Rayfield, et al., 2007) sex was not found to have an influence on participant achievement in this research. This finding is, however, in agreement with the findings of England (1996) and Webster, Young and Fisher (1999). Obviously, more research needs to be conducted to investigate the influence of this factor upon achievement in this and other FFA activities.
This study confirms the findings of Thomas and Stockton (2003) stating that socioeconomic status, as measured by status of free/reduced lunch, affects student achievement. Conversely, the conclusion of this study related to socioeconomic status conflicts with the findings of Webster, Young and Fisher (1999). This study suggests individual student differences, including prior experience and socioeconomic status, play a role in student achievement (Weiner et al. 1971; Sutton & Soderstrom, 1999; Schunk, 2004). In future research, the category of free/reduced lunch should be separated into free lunch and reduced lunch as there is a difference in the socioeconomic status categories of the two categories.
In agreement with a study of the relationship in demographic variables and performance in a National FFA CDE by Rayfield, et al. (2007), this study found GPA to have an impact on student performance. The researchers draw caution to comparing these results of these two studies, however. The 2007 study evaluated students at a national CDE, implying that each student was successful at the state level, whereas this study compared students who competed at the district level used to qualify to compete at the state level.
The results of this study suggest that IEP status and previous experience in Livestock Evaluation CDE are associated with student success. The positive aspect of this finding is that both of these factors have a degree of manageability by the agriculture teacher. Considering it is the responsibility of the teacher to meet the educational needs of all students, it is recommended that school-based agriculture teachers be given additional professional development opportunities and training on how to accommodate the specialized needs of diverse learners. If school-based agriculture teachers are able to obtain proper training for working with students with special needs, the accommodations could increase the likelihood of overcoming the dimensions and causal factors that limit the student’s success according to Weiner’s theory (1971).
Further research is needed to determine the variation of the characteristics investigated in this research between national and state level competitions. For this study, data were collected only on students at the extreme ends of performance in one CDE. Students composing the complete range of performance at such FFA activities should be examined. A study in which data are collected on every student from multiple CDEs would add to the body of knowledge related to the effect of demographic variables on participant performance. Such information would provide another method to evaluate whether or not FFA CDEs contribute to the mission of the organization.
Teacher educators and state staff should consider reinforcing the purpose of CDEs, as defined by the National FFA Organization, to all school-based agricultural teachers. It could be argued that results of this study illustrate that a diverse group of students are presented with the opportunity to compete in CDEs. However, the homogeneity of the two groups studied in this investigation, highest performers and lowest performers, indicates that the educational needs of lowest performers are not being met. Further research is needed to determine how agricultural educators can best help students facing issues of socioeconomic status and academic ability. Such information could enhance educators’ ability to help students overcome success barriers in competitive events like CDEs.
References
Alfeld, C., Hansen, D. M., Aragon, S. R., & Stone, J. R. (2006). Inside the black box: Exploring the value added by career and technical student organizations to students’ high school experience. Career and Technical Research. 31(3), 121-155.
Ary, Donald, Jacobs, L.C., Razavieh, A., & Sorensen, C. (2006). Introduction to research in education (7th edition). Belmont, CA. Thomson Higher Education.
Association for Career and Technical Education (2010). About ACTE. Retrieved April 2010 from: http://www.acteonline.org/
Ball, A. L., Garton, B. L., & Dyer, J. E. (2001). The influence of learning communities and 4- H/FFA participation on college of agriculture students’ academic performance and retention. Journal of Agricultural Education. 42(4), 54-62.
Berry, W. D. & Feldman, S. (1991). Multiple Regression in Practice. Newbury Park, CA: Sage Publications.
Bokhorst, C., Sumter, S., and Westenberg, M. (2009) Social support from parents, friends, classmates, and teachers in children and adolescents aged 9 to 18 years: who is perceived as most supportive? Social Development. 19(2), 417-426.
Chiasson, T., & Burnett, M. (2001). The influence of enrollment in agriscience courses on the science achievement of high school students. Journal of Agriculture Education. 42(1), 61-71.
Child Nutrition Programs—Income Eligibility Guidelines / 58,74 Federal Register § 13412 (2009)
Cohen, J. (1988). Statistical Power Analysis for the Behavioral Sciences (2nd ed.). Lawrence Erbaum Associates.
England, L.M. (1996). Training methods of national FFA judging teams. Unpublished master’s thesis, Texas Tech University, Lubbock.
Gohm, C., Oishi, S., Darlington, J., & Diener, E. (1998). Culture, parental conflict, parental marital status, and the subjective well being of young adults. Journal of Marriage and the Family. 60(1), 319-334.
Greenland, S., Schwartzbaum, J. A., & Finkle, W. D. (2000). Problems due to small samples and sparse data in conditional logistic regression. American Journal of Epidemiology, 151(5), 531-539.
Huck, S. W. (2008). Reading statistics and research. Boston, MA: Pearson.
Johnson (1991) Student achievement and factors related to achievement in a state FFA agricultural mechanics contest. Journal of Agricultural Education, 32(3), 27-28.
Kopcha, T., & Sullivan, H. (2008). Learner preferences and prior knowledge in learner controlled computer based education. Education Technology Research, 56(1), 265-286.
Licht, B.G., & Kistner, J. A. (1986). Psychological and educational perspectives on learning disabilities. Orlando, FL: Academic Press.
Missouri Department of Elementary and Secondary Education (2009). About agricultural education. Retreived April 2010 from http://dese.mo.gov/divcareered/ag_about.htm
Missouri FFA Association. (2008). State career development handbook 2006-2010. (City, State): Missouri Vocational Agriculture Teacher Association.
Morgan, E. M., Chelewski, R. E., Lee, J. S., & Wilson E. (1998). Agriscience explorations. Danville, IL: Interstate Publishers.
National Research Council (2000). How people learn. Washington, D.C.: National Academy Press.
National FFA Organization. (2009). Official FFA manual. Indianapolis, IN: National FFA Organization.
Oliver, J.D. & Hinkle, D.E. (1982). Occupation education research: Selecting statistical procedures. Journal of Studies in Technical Careers, 4, 199-208.
Okpala, C. O. (2002) Educational resources, student demographics and achievement scores. Journal of Education Finance, 27(3), 885-908.
Phipps, L. J., Osborne, E. W., Dyer, J. E., & Ball, A. L. (2008). Handbook on agricultural education in public schools (6th edition). Clifton Park, NY: Thomson Delmar Learning.
Rayfield, J. (2006). An assessment of recruitment and training practices of the National FFA livestock career development event. (Doctoral dissertation, Texas Tech University). Retrieved from http://esr.lib.ttu.edu/handle/2346/1041
Rayfield, J., Fraze, S., Brashears, T., & Lawver, D. (2007). The relationship between student demographic variables and performance in a National FFA career development event. Journal of Southern Agricultural Education Research, 57( 1), 4-15.
Reis, R., & Kahler, A. A. (1997). Factors influencing enrollment in agricultural education programs as expressed by Iowa secondary agricultural education students. Journal of Agricultural Education, 38(2), 38-48.
Rumburger, R., & Palardy, G. (2005). Does segregation still matter? The impact of student composition on academic achievement in high school. Teachers College Record, 107(9), 2000-2045.
Schunk, D. H. (2004). Learning theories: An educational perspective (4th edition). Upper Saddle River, New Jersey: Pearson Education.
Sutton, A., & Soderstrom, I. (1999). Predicting elementary and secondary school achievement with school-related and demographic factors. The Journal of Educational Research, 92(6), 330.
Talbert, B.A., & Balschweid, M.A. (2005). Engaging students in the agricultural education model: Factors affecting student participation in the National FFA Organization. Journal of Agricultural Education, 45(1), 29-41.
Tenney, A. W. (1977). The FFA at 50: A golden past a bright future. Alexandria, VA: The Future Farmers of America.
Thomas, J., & Stockton, C. (2003). Socioeconomic status, race, gender, & retention: Impact on student achievement. Available: http: //www.usca.edu/essays /vol72003 /stockton.pdf.
U.S. Department of Education (2009). National center for educational statistics. Retrieved April 2010 from http://www2.ed.gov/rschstat/facts.html
Weiner, B. (1979). A theory of motivation for some classroom experiences. Journal of Educational Psychology, 71, 3-25.
Weiner, B., Frieze, I. H., Kukla, A., Reed, L., Rest, S., & Rosenbaum, R. M. (1971). Perceiving the causes of success and failure. Morristown, NJ: General Learning Press.