Category

Vol. 73

Preservice Teachers’ Perceptions of their Ability to Use The AET as a Data Management System

Tyler J. Price, Oklahoma State University, tyler.price10@okstate.edu

Emily O. Manuel, Oklahoma State University, emily.manuel@okstate.edu

Emily A. Sewell, Oklahoma State University, easewel@okstate.edu

J. Shane Robinson, Oklahoma State University, shane.robinson@okstate.edu

PDF Available

Abstract

An increased emphasis has been placed on teaching financial literacy at the secondary school level. As such, SBAE teachers have a unique opportunity to teach students about maintaining records and managing data through the Agricultural Experience Tracker (AET). AET has been used nationwide by SBAE teachers to teach students how to manage finances and maintain proper records. The purpose of the study was to describe the self-perceived and actual efficacy of preservice SBAE teachers toward operating and managing student projects through AET. Forty-two preservice SBAE teachers from Oklahoma State University were instructed in the use of AET. The study measured the students’ perceived self-efficacy to use AET at three points during the 16-week semester. Results showed that students’ self-perceived and actual abilities to use AET increased across all areas throughout the semester. However, although their actual ability to use Financial Applications in AET increased across all three observations, their mean scores were still below a 60%, indicating a failing grade. The state office of career and technical education in Oklahoma should be alerted to the actual competency and self-efficacy levels of the new teachers in the state so that appropriate professional development may be provided once these students enter the teaching ranks.

Introduction

Debate exists on whether financial literacy should be taught as a stand-alone course or by integrating it into other curricular areas (Totenhagen et al., 2015). Financial literacy is a critical aspect of being a productive member of society in a culture that requires fiscal responsibility to be self-sufficient (Shim et al., 2009). Therefore, it is imperative that adolescents learn about financial matters to prepare them for the transition to adulthood (Shim et al., 2009). The increased interest in teaching financial literacy in U.S. schools has been on the uprise since the 1990s (Walstad et al., 2010). What is understood about financial literacy is that educators should provide opportunities for students to invest their own money, make decisions, and apply concepts related to managing it appropriately, and at minimum should include course topics such as budgeting, saving, and investing, as well as understanding credit and how it is generated (Totenhagen et al., 2015). Parents, schools, and entrepreneurs should create partnerships that are dedicated to teaching youth sound financial practices (Shim et al., 2009). Walstad et al. (2010) identified that a properly implemented program designed to increase financial literacy can significantly impact the knowledge of high school students regarding their finances. The use of simulation-based learning methods has also shown to be a powerful educational intervention that creates environments conducive to student learning (Warren et al., 2016). Levant et al. (2016) posited that business simulations have the potential to benefit all students regardless of gender identities, cultural backgrounds, and previous experiences. Such simulations have shown promise in school-based agricultural education (SBAE) programs. Brown and Knobloch (2022) identified that the use of simulation by SBAE teachers to teach business management skills was better at increasing students’ financial literacy compared to playing a game about business management.

SBAE provides opportunities for students to manage data and maintain records on their agricultural enterprises and projects. In fact, The National Council for Agricultural Education (2011) found the topic so important they included personal financial planning and management as a mandate for each Foundational Supervised Agricultural Experience (SAE) for students. The goal of the National Council for Agricultural Education (2011) was to have 100% SAE engagement among students. A project known as SAE for All was developed to serve as a resource for SBAE teachers to use in their classrooms due to the need to help students acquire financial planning and management skills through their SAEs (The National Council for Agricultural Education, 2011). In addition to adding financial planning as a mandate for SAE projects, the National Council for Agricultural Education’s (2015) revision of the National Agriculture Food and Natural Resources (AFNR) Content Standards included adding the management of personal finances to the Career Ready Practices content standards. Even so, teaching financial literacy to students has been, and continues to be, a difficult proposition for SBAE teachers (Foster, 1986; Layfield & Dobbins, 2002; Miller & Scheid, 1984; Sorensen et al., 2014; Toombs et al., 2020).

One issue related to teaching financial literacy in SBAE has been the lack of emphasis placed on teaching it, as it remains a high inservice need of all teachers (Sorensen et al., 2014). Part of being an effective teacher is having the appropriate content and pedagogical knowledge necessary to effect student learning (Goodnough & Hung, 2008). Fortunately, teacher preparation programs can positively impact SBAE teachers’ ability to teach specific content (Rice & Kitchel, 2015). Teacher preparation programs are fundamental to teachers’ pedagogical content knowledge (Rice & Kitchel, 2015). For this study, understanding preservice SBAE teachers’ experience using AET can help us identify their perceived self-efficacy using the software, which is imperative to enhancing the interests of students in entrepreneurship and business management and increasing their financial literacy (Brown & Knobloch, 2022).

AET

The AET program was released in 2007 as a data management system designed to assist SBAE instructors teach aspects of record keeping to students regarding their SAEs (The Agricultural Experience Tracker, 2017). Although numerous states have adopted AET as their primary data management system for FFA members, research continues to point to the fact that teachers are ill equipped for using it appropriately and need professional development (Ferand et al., 2020; Sorensen et al., 2014; Toombs et al., 2022). According to Aviles (2015), SBAE teachers found AET to be too complex and time consuming. Sorensen et al. (2014) found AET was one of the highest in-service needs of both early-career (i.e., those with less than six years of experience) and experienced agricultural education teachers (i.e., those with six or more years of experience) in Oregon. What is more, research has indicated that preservice teachers have a low amount of overall self-efficacy related to managing the financial data aspect (i.e., record books) of their students’ SAEs (Toombs et al., 2022), signifying a need for further inquiry in this field. As an interactive software for record keeping, Totenhagen et al. (2015) and Brown and Knobloch (2022) posited that the use of interactive learning experiences and curriculum integration are the best methods for delivering financial literacy content to students. Activities in AET such as the Personal Finance Lab, Practice AET Curriculum, and Agribusiness Management Resources provide SBAE teachers with the tools needed to teach financial literacy (AET, 2023b). Additionally, AET provides SBAE teachers with specific tools to assist in managing their chapter’s activities and students’ projects (AET, 2023a).

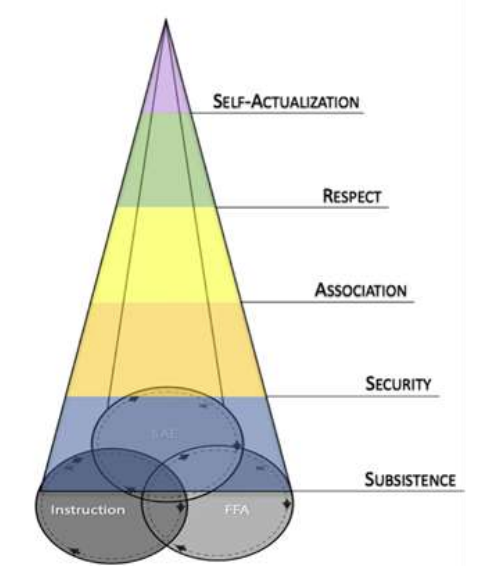
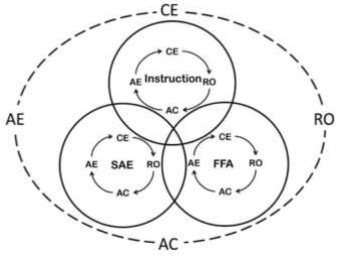
AET has been used nationwide by SBAE teachers and students to assist in the acquisition of record keeping skills in time and finance (Hanagriff, 2022). In 2021, more than 8,000 SBAE and FFA programs and 1.1 million SBAE students used AET to assist in tracking Supervised Agricultural Experiences (SAEs), recording FFA activities, and creating and managing FFA award applications (Hanagriff, 2022). AET aligns with the three-circle model of agricultural education and was supported through the use of Perkins and state-curricular funding (The AET, 2023a). As a result, AET has been adopted by 91% of all SBAE and FFA Programs across the U.S. (Hanagriff, 2022). As such, it was recommended that teacher preparation programs prepare teachers to use resources, such as AET, to meet the goals of their students. The suggestion is imperative, as all teachers should be trained on how to access curricular resources and how to evaluate them for use with their students (Mercier, 2015). Despite the widespread adoption of AET by SBAE teachers across the country, little research existed regarding preservice teachers’ self-efficacy for using it. Additionally, research assessing teacher preparation programs’ ability to effectively prepare preservice teachers to instruct students in AET has been largely left out of the cannon of agricultural education research. With the heavy expectation to integrate AET into SBAE programs, what impact can a semester-long course have on students’ self-perceived and actual abilities to use it?

Theoretical Framework

Bandura’s (1977) self-efficacy theory guided the study. Self-efficacy is the belief a person has in his or her ability to perform a specific task or tasks (Bandura, 1977). It is advanced through the repetition of completing the task with the assistance of a mentor. Self-efficacy can increase with a person’s successes and decrease with their failures to complete the task (Wilson et al., 2020) and is largely dependent on an individual’s continual effort, devotion, and behavior toward completing the task (Walumbwa et al., 2011). Four sources impact a person’s self-efficacy (Bandura, 1994). These sources include mastery experiences, psychological arousal, vicarious experiences, and verbal persuasion. Mastery experiences provide the greatest opportunity for increased self-efficacy when individuals succeed at, or accomplish, a task. Vicarious experiences aid in improving self-efficacy when individuals are involved in the experience of observing others (i.e., models) successfully complete a task. Verbal persuasion is produced through encouragement and occurs when individuals are told they “. . . have what it takes to succeed” (Bandura, 1994, p. 3). Physiological arousal is related to how individuals react to the situations they encounter (Bandura, 1994). With the need to increase financial literacy among students across the U.S. school system, and the role SBAE teachers can play in creating such authentic learning opportunities and experiences, it was important to assess students who aspire to be SBAE teachers on their self-perceived and actual abilities to use AET.

Background of the Study, Purpose, and Objectives

Preservice students enroll in AGED 3203: Advising Agricultural Student Organizations and Supervising Experiential Learning during their junior year where they learn about various aspects of FFA and SAE. The course included laboratories where students engage with all aspects of the program, such as advising a local FFA Chapter, supervising student projects, and managing data through AET, as students log entries, produce reports, and complete award applications from fictitious data sets. These experiences were designed to prepare students for their future expectations as SBAE teachers once they enter the academy. As such, AGED 3203 sought to improve student knowledge and experiences related to financial literacy and data management using AET. The course description was as follows:

This course is designed to determine the resources and trends of local communities with respect to agricultural production and agribusiness. Emphasis will be placed on agricultural education program policies, FFA chapter advisement, planning and managing the instructional program, and the identification and completion of records and reports required of a teacher of agricultural education in Oklahoma. (Robinson, 2022, p. 1)

The larger aim of the course was to prepare preservice teachers for implementing effective FFA and SAE programs at the secondary school level. Such preparation includes teaching students to use AET to track their data in hopes of becoming financially literate. To do so, preservice teachers must feel efficacious at using AET. Yet, research has indicated that some people tend to overestimate their efficacy (Woolfolk Hoy & Spero, 2005). It may be possible others underestimate their efficacy. To support such a claim, Robinson and Edwards (2012) assessed the teaching self-efficacy of first-year traditionally and alternatively certified SBAE teachers. They found that traditionally certified teachers consistently outperformed their alternatively certified teaching counterparts when assessed by a third-party observer. Although their actual performance indicators were significantly higher statistically, their self-perceived ratings were lower when compared to their alternatively certified peers. We attributed this difference to the fact that alternatively certified teachers had not been prepared in pedagogy and as such did not know what they did not know about teaching (Robinson & Edwards, 2012). Therefore, this study sought to explore the self-perceived and actual efficacy of preservice SBAE teachers toward operating and managing student projects through AET. The study was guided by the following research objectives:

  1. Describe the personal characteristics of students enrolled in the course,
  2. Describe the perceived self-efficacy of preservice SBAE teachers to use AET for managing student projects; and
  3. Describe the abilities of preservice SBAE teachers to use and advise students in AET.

Methods

The study was approved by the Oklahoma State University (OSU) Institutional Review Board (IRB) on January 26, 2022. This manuscript was based on data presented at the meeting of the Southern Association of Agricultural Scientists (Blinded Authors, 2023). All students (N = 42) enrolled in the junior-levelAGED 3203 at OSU during Spring 2022 were invited to participate in the study. Participation in the study was voluntary and students’ final grade was not affected by their consent to participate or not. Links to the questionnaire were made accessible to the students through the Canvas learning management system for one class day for students to complete. The use of classroom announcements and text reminders were used to recruit participants.

Three points of data were collected. The first data collection point (n = 41) occurred Week 1, the second (n = 41) occurred Week 8, and the third (n = 32) occurred Week 16 (the beginning, middle, and end of the semester). Students completed a questionnaire using Qualtrics regarding their perceived self-efficacy for using AET along with three AET Quizizz assessments.

The questionnaire included personal characteristic questions and 22 statements regarding their perceived self-efficacy to perform various competencies in AET. Each competency statement was rated on a 5-point, Likert-type scale ranging from 1= Strongly Disagreeto 5 =Strongly Agree. Statements were derived from AET Quizizz assessments. Twenty-two complementary statements were developed to determine the perceived self-efficacy of the participants when using AET. For example, one question on the Quizizz asked, “As an FFA officer, where do you record your officer meetings and chapter meetings?” The complementary perceived self-efficacy statement was “Log FFA Activities.” Another Quizizz example was, “After logging into your AET, (blank) should be completed 100% before beginning any other entries.” The complementary perceived self-efficacy statement was, “Create a student AET profile.”

After completing the questionnaire to measure their perceived self-efficacy, the participants then completed three AET Quizizz assessments to measure their actual self-efficacy. The three AET Quizizz assessments addressed student knowledge of AET icons, financial applications, and record book terms. The questionnaire and three assessments were all taken at each data collection point – Weeks 1, 8, and 16.

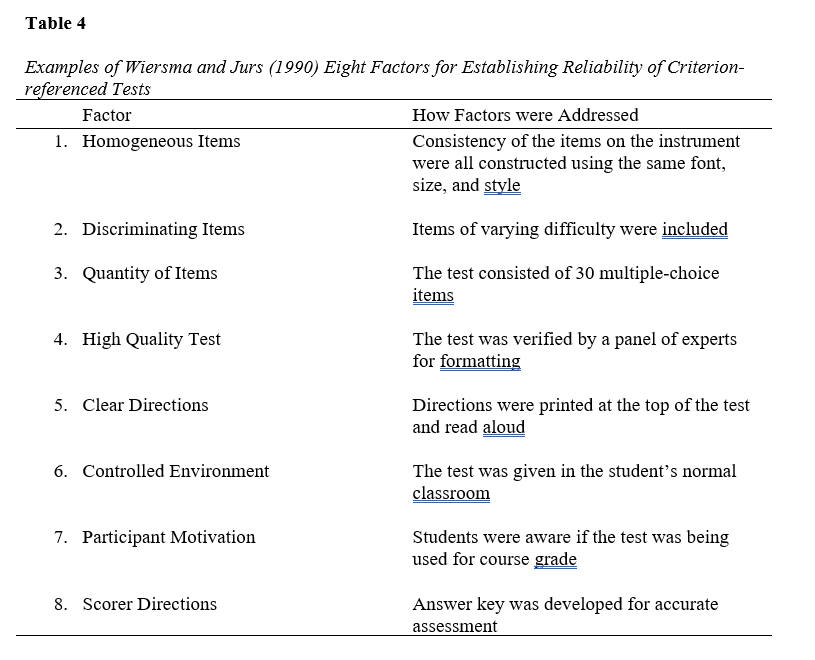
Face and content validity were assessed by a panel of five experts. In total, our panel possessed 17 years of secondary agricultural education teaching experience, and 23 years of postsecondary agricultural education teaching experience. Further, four of the five members have used AET as secondary agricultural education teachers, and all five currently teach preservice teachers to use AET. A pilot study was not conducted; therefore, we admit that reliability was a limitation of the study. However, the items we used in the Quizziz were taken verbatim from the AET. As such, we chose to treat the reliability as being criterion-referenced (CRT). Because the test followed the eight methods of reliability for a CRT, according to Wiersma and Jurs (1990), we deemed the study reliable.

Descriptive statistics, including central modes of tendency (means and standard deviations) and variability (frequencies and percentages), were used to analyze the data. Personal characteristics included student type (traditional four-year or transfer), FFA degree(s) obtained, FFA office(s) held, and years of FFA experience. Student perception data were analyzed by recording the mean and standard deviation for the group at each of the three data collection points. The change in mean scores between observations one and three were calculated to determine the change in perceptions from the beginning to end of the semester.

 Results/Findings

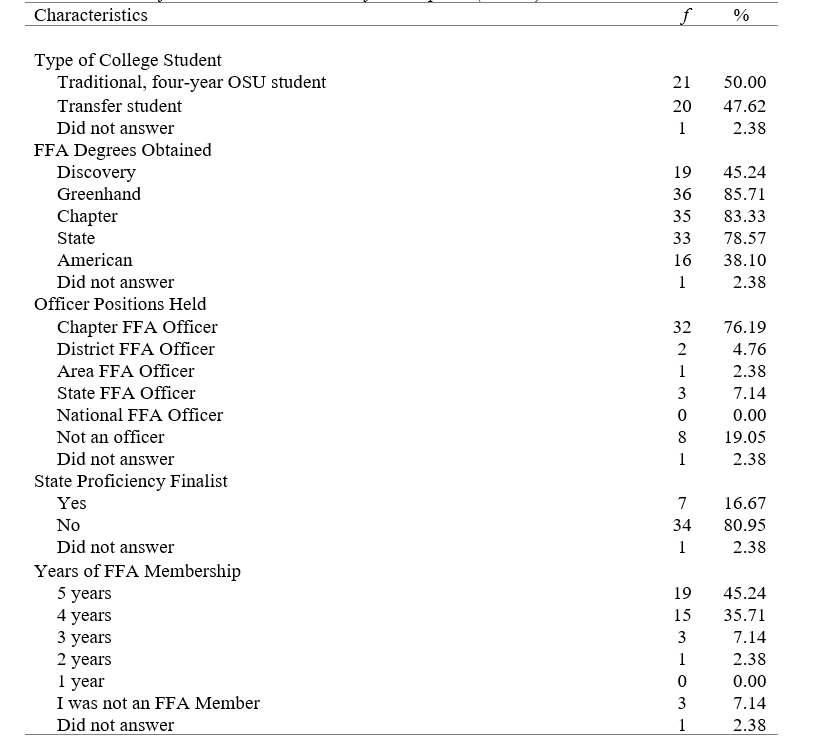
Objective one sought to describe the personal characteristics of the students enrolled in AGED 3203. The personal characteristics of the students are presented in Table 1. One-half (f = 21) were traditional, four-year students with the other one-half (f = 20) being transfer students. Thirty-six (85.71%) of the students had received their Greenhand FFA Degree, and 16 (38.10%) had received their American FFA Degree. Thirty-two (76.19%) had served as a Chapter FFA Officer, two (4.76%) had served as a District FFA Officer, and three (7.14%) had served as a State FFA Officer. Seven (16.67%) had been a State Proficiency Finalist while 19 (45.24%) had been an FFA member for five years, and 15 (35.71%) had been a FFA member for four years (see Table 1).

Table 1

Personal and Professional Characteristics of Participants (N = 42)

Objective two sought to describe the perceived self-efficacy of preservice SBAE teachers to use AET for managing student projects. Mean scores were compared across observations. To determine overall change of students’ self-perceived efficacy in AET, mean difference (MD) scores were computed by subtracting the mean score in Data Collection 1 from the mean score in Data Collection 3 (see Table 2). In all, student perceptions ranged from the real limits of disagree to agree on all statements in Data Collection 1 and increased from neither agree or disagree to strongly agree in Data Collection 3.

Table 2

Perceived Self-Efficacy of Students (N = 42)

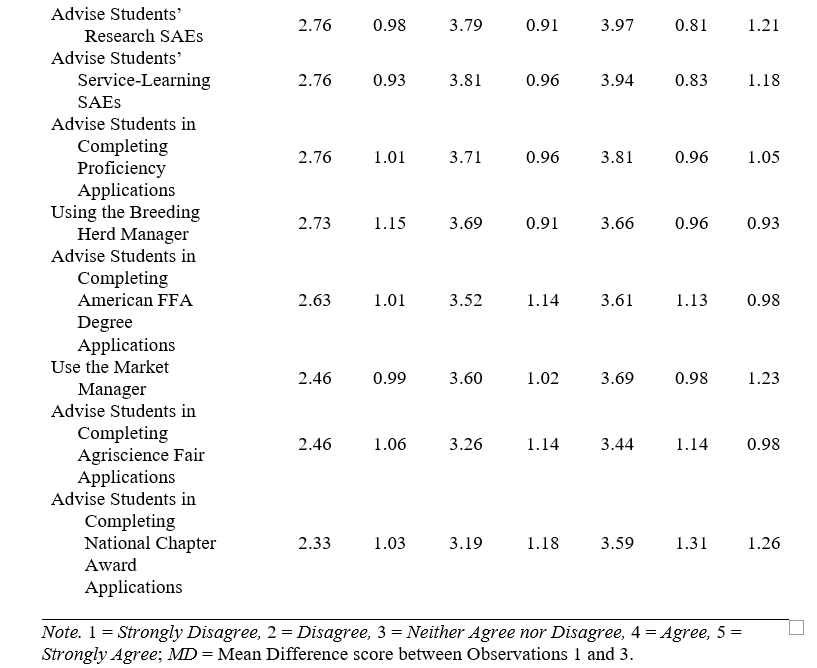
The highest mean score for students in Data Collection 1 was Log FFA Activities (M = 3.71, SD = 0.89), followed by Enter Journal Entries (M = 3.68, SD = 0.92), and Enter Financial Entries (M = 3.66, SD = 0.90). Advise students in Completing National Chapter Award Applications (M = 2.33, SD = 1.03) was the statement that had the lowest mean score for Data Collection 1 (see Table 2).

Regarding Data Collection 2, Enter Journal Entries (M = 4.36, SD = 0.61) had the largest mean score, followed by Enter Financial Entries (M = 4.29, SD = 0.76), and Create a Student AET Profile (M = 4.26, SD = 0.62). Advise Students in Completing National Chapter Award Applications (M = 3.19, SD = 1.18) was the statement that had the lowest mean score of Data Collection 2 (see Table 2).

Regarding Data Collection 3, Enter Journal Entries (M = 4.53, SD = 0.56) had the largest mean score, followed by Log FFA Activities (M = 4.34, SD = 0.59), and Enter Financial Entries (M = 4.25, SD = 0.83). Advise students in Completing National Chapter Award Applications (M = 3.59, SD = 1.31) was the statement that had the lowest mean score of Data Collection 3 (see Table 2).

Students experienced the greatest amount of perceived growth in the areas of National Chapter Award Applications (MD = 1.26), Use the Market Manager (MD = 1.23), and Advise Students’ Research SAEs (MD = 1.21). The least amount of perceived growth occurred in the ability to use AET to Log Community Service Activities (MD = 0.58), Enter Financial Entries (MD = 0.59), and Create a Student AET Profile (MD = 0.60). All statements experienced a positive increase in student self-efficacy mean scores from Data Collection 1 to Data Collection 2. The majority of the statements also experienced an increase from Data Collection 2 to Data Collection 3. However, Enter Financial Entries, Create a Student AET Profile, and Using the Breeding Herd Manager all experienced slight decreases in mean scores from Data Collection 2 to Data Collection 3, but these values were still greater than their mean scores detected in Data Collection 1 (see Table 2).

Objective three sought to determine students’ actual ability to identify features and use AET as a curricular resource for SAEs across the semester. The AET Quizizz were used to measure student knowledge of the data management program. Mean scores were compared across observations for each assessment as well as cumulatively (see Table 3).

Table 3

Actual Ability of Participants to Identify and Use Features within AET (N = 42)

At the time of Data Collection 1 students had a cumulative score of 57.40 (see Table 3). Regarding the quiz components, they collectively scored 62.20 on the Record Book Terms, 57.07 on AET Icons, and 55.80 on Financial Applications.

During Data Collection 2, students increased their cumulative score to a 65.93 (see Table 3). In the individual quiz areas, participants scored 74.86 on the Record Book Terms, 70.48 on the AET Icons, and 57.19 on the Financial Applications.

During Data Collection 3, students had a cumulative score of 65.02 (see Table 3). For the quiz components, they scored 69.49 on the Record Book Terms, 69.20 on the AET Icons, and 59.10 on the Financial Applications.

Students’ actual knowledge of AET Icons, Financial Applications, and Record Book Terms increased between Observations 1 and 2, with Record Book Terms and AET Icons both increasing by more than ten percent. However, during Data Collection 3, Record Book Terms and AET Icons exhibited a decrease in students’ actual ability to recall terms and identify icons. Although slight, actual ability to determine correct Financial Applications increased throughout all three observations. Cumulatively, students’ actual ability to use AET increased from Data Collection 1 to Data Collection 2, and then slightly decreased when evaluated in Data Collection 3. The greatest growth of AET Quiz Components from Week 1 to Week 16 was realized for AET Icons (MD = 12.13). In comparison, Financial Applications experienced the least amount of change (MD = 3.30) in students’ actual ability throughout the semester-long course experience.

Conclusions

Students failed to reach a level mastery of using AET Financial Applications across the 16-week instruction period.Although students’ actual ability to determine Financial Applications in AET increased across the three observations, their mean scores were still below a 60%, indicating a failing grade. Unfortunately, students were only able to increase their overall knowledge of AET by a total of eight and one-half points (a grade of D) from Week 1 to Week 16. Simply stated, participants were not proficient in the financial applications of AET, which is concerning considering the importance of teaching financial literacy in the current climate (Totenhagen et al., 2015). These results also showed that students were not able to master a core piece of the course’s purpose which was to identify and complete records and reports required of SBAE teachers using programs required in Oklahoma (Robinson, 2022). In addition to failing to meet the purpose of the course, these scores also show that many of the participants were unable to appropriately use AET as a chapter management tool (AET, 2023a). These poor scores were also concerning as fewer states look to add economics and personal finance courses to their graduation requirements (CEE, 2022). These findings also support those of Aviles (2015) who found that the areas of financial applications were areas where many struggled when utilizing the tools of AET.

Roughly one-half of the students began their undergraduate education at OSU. Three (7%) students were not FFA members in high school. In addition, 21% of the students did not receive their State FFA Degree, and only 17% had been a finalist for a State FFA Proficiency Award. Therefore, it is possible that a high number of students failed to have adequate experience with AET as high school students prior to this course. As such, it might be unfair to expect these students to obtain mastery (Bandura, 1994) in AET after one class. In addition, this lack of experience in the use of AET could have an impact on pedagogical content knowledge specifically (Rice & Kitchel, 2015).

Students’ self-perceived abilities to use AET increased across all areas throughout the semester, which supports Bandura’s (1977) assertion that self-efficacy is solidified through rich experiences of performing a particular task over time. Increases were detected across the semester in all 22 statements, indicating that the students improved their efficacy for using the software and advising student SAEs because of the course. The term Advising Students in Completing National Chapter Award Applications was rated lowest in self-perceived ability by students in all three observations. However, it was also the statement that experienced the greatest amount of overall mean difference change throughout the semester.

Students’ actual abilities also increased overall when compared across the three-point time series; however, the growth might not be sustained long term, as scores showed a decrease between observations two and three in comparison to those noted between observations one and two. It is possible that the results might be attributed to the timing of the presentation of content related to AET. Specifically, aspects of AET were emphasized heavily during the first one-half (eight weeks) of the semester, and then tapered off toward the end of the semester. The more elevated scores detected from Data Collection 1 to Data Collection 2 may be due to the recency effect of the emphasis of AET during that time frame.

Recommendations

The study was limited to the delivery of AET content and generalizability of its results. An assumption was made that the same content and activities featuring AET would be taught and implemented each week by the three teaching assistants charged with delivering content to their respective laboratories. Although weekly meetings were held throughout the semester to attempt to maintain fidelity and consistency of such, differences in teaching assistants’ personalities, teaching styles, and experiences using AET as former SBAE teachers themselves undoubtedly existed and could have impacted the study’s findings. participants’ prior experience in AET was not collected, and their experience may have impacted the findings. Therefore, we acknowledge the results of the study could be limited by these factors. Moreover, the study included a convenient sample of students enrolled in a required teacher preparation course offered at the junior level at one institution.

Given the results cannot be generalized to all preservice SBAE teachers across the country, it is recommended additional research on the self-efficacy and actual ability of preservice teachers to implement AET is conducted with a larger population of preservice teachers. We recommend other preservice institutions replicate this study to determine if the findings hold true across other university settings. We also recommend that correlational studies ensue to assess students’ abilities to effectively use AET based on their involvement in FFA activities at the secondary school level. Further research also should investigate whether the use of AET does in fact increase financial literacy. It is recommended that a financial literacy assessment be used to determine if the use of AET, SBAE’s version of a simulation-based method, improved financial literacy of the participants (Levant et al., 2016). These future studies should identify the effectiveness of the training resources provided by AET to instruct students in proper data management and record keeping strategies.

Regarding the course content, students need additional experience with the statement: Advising students in completing National Chapter Award Applications, as students consistently rated it as the lowest mean value in each of the three observations. Perhaps the reason for this poor rating was due to students not currently having the opportunity to work with actual data from FFA members. Students be paired with a mentor teacher and FFA members in SBAE programs so that they can experience a richer connection to AET and obtain real-world experience with advising students who are working on award applications as part of their SAE program. Providing dedicated time for students in this course to interact with FFA members while using AET would likely increase their readiness to learn and afford concrete experiences for preservice teachers to learn the content while using actual student data and working with a mentor teacher.

Further, it was important to determine the impact of this preparation on students as they enter the teaching profession. Are they better prepared for integrating AET into their classrooms and FFA programs having learned about and used it for multiple weeks as part of their preservice preparation? Or, is readiness to learn the criterion absent or minimized during this phase of their preparation? Regardless, AET should be a point of emphasis during the student teaching internship and again, as professional development, after students have accepted positions during their first year of teaching. Conducting a longitudinal trend study would provide comparisons between perceived and actual self-efficacy of teachers based on actual projects and experiences of their students and their readiness to learn such content. Finally, regarding teaching styles of graduate teaching assistants, a quasi-experimental study should be conducted in which different pedagogies are used to instruct students in the use of AET. A comparison of such across different laboratory settings could aid in identifying the most effective method of instruction for teaching students the importance of using AET and how to do so most effectively. Regarding states that do not use or require AET in the agricultural education program, it was recommended that a similar study be conducted to understand the perceived and actual self-efficacy of preservice SBAE teachers in using the software used within that state.

Discussion

The most effective ways of teaching young people to become financially independent, literate, and to make good investment decisions is an important topic that should continue to be discussed and considered by SBAE teachers. The current study provides additional insight into the practice of preparing SBAE teachers. The timing of when to teach certain topics to students is an imperative task for all teacher preparation programs. Perhaps students simply were not ready to learn all aspects of AET during the spring semester of their junior year. Based on the findings of this study, it is imperative that we, as a teacher preparation program, implement aspects of AET into other preservice courses, where appropriate, to provide students additional opportunities and iterations necessary for mastery experiences (Bandura, 1994). It is possible the students in this study experienced the largest growth in mean difference of perceived ability to complete National Chapter Award applications because of a project where they plan out mock events. Therefore, growth is observed in the preservice courses where opportunities to learn through doing is possible. In addition, regarding the practice of teaching SBAE, the state office of career and technical education in Oklahoma should be alerted to the actual competency and self-efficacy levels of the new teachers in the state so that appropriate professional development may be provided once these students enter the teaching ranks. Finally, it is entirely possible that students overestimate their abilities to perform certain tasks (Woolfolk Hoy & Spero, 2005), especially when interfacing with that content over the course of a semester. Therefore, it is necessary that continued follow-up training and support exist to ensure that perceived self-efficacy eventually leads to actual competence.

References

Aviles, H. A. (2015). An examination of Oklahoma agricultural educators’ innovativeness and perception regarding the mandated adoption of the agricultural experience tracker. [Master’s thesis, University]. ProQuest. https://www.proquest.com/dissertations-theses/examination-oklahoma-agricultural-educators/docview/1965469087/se-2

Bandura, A. (1994). Self-efficacy. In V. S. Ramachaudran (Ed.), Encyclopedia of human behavior, 4, 71–81.

Bandura, A. (1977). Self-efficacy: Toward a unifying theory of behavioral change. Psychological Review, 84(2), 191–215. https://doi.org/10.1037/0033-295X.84.2.191

Brown, A. H., & Knobloch, N. A. (2022). Effects of a simulation on eight grade students’ management knowledge and entrepreneurial intent in an exploratory agriculture course. Journal of Agricultural Education, 63(1), 88–101. https://doi.org/10.5032/jae.2022.02088

Council for Economic Education (CEE). (2022). CEE’s 2022 survey of the states. https://www.councilforeconed.org/survey-of-the-states/

Ferand, N. K., Thoron, A. C., & Myers, B. E. (2020). The relationship of prior FFA membership on perceived ability to manage an FFA chapter. Journal of Agricultural Education, 61(2), 162–172. https://doi.10.5032/jae.2020.02162

Foster, R. M. (1986). Factors limiting vocational agriculture student participation in supervised occupational experience programs in Nebraska. Journal of the American Association of Teacher Educators in Agriculture, 27(4), 45–50. https://doi.org/10.5032/jaatea.1986.04045

Goodnough, K. C., & Hung, W. (2008) Engaging teachers’ pedagogical content knowledge:     Adopting a nine-step problem-based learning model. Interdisciplinary Journal of                               Problem-Based Learning, 2(2), 61–90. https://doi.org/10.7771/1541-5015.1082

Hanagriff, R. (2022). 2021 agricultural education engagement executive summary report.             https://theaet.com/docs/2021%20COMBINED%20Agricultural%20education%20Values%20(8.25%20×%2011.5%20in)%20(2).pdf

Layfield, K. D., & Dobbins, T. R. (2002). Inservice needs and perceived competencies of South Carolina agriculture teachers. Journal of Agricultural Education, 43(4), 46–55. https://doi.org/10.5032/jae.2002.04046      

Levant, Y., Coulmont, M., & Raluca, S. (2016). Business simulation as an active learning activity for developing soft skills. Accounting Education, 25(4), 368–395. https://dx.doi.org/10.1080/09639284.2016.1191272

Mercier, S. (July, 2015). Food and agricultural education in the United States. AGree Transforming Food & Ag Policy Report.

Miller, W. M., & Scheid, C. L. (1984). Problems of beginning teachers of vocational agriculture in Iowa. Journal of the American Association of Teacher Educators in Agriculture, 25(4), 2–7. https://doi.org/10.5032/jaatea.1984.04002

Robinson, J. S. (Spring 2022). AGED 3203: Advising agricultural student organizations and supervising experiential learning [Syllabus]. Department of Agricultural Education, Communications, and Leadership. Oklahoma State University.

Sorensen, T. J., Lambert, M. D., & McKim, A. J. (2014). Examining Oregon agriculture teachers’ professional development needs by career phase. Journal of Agricultural Education, 55(5), 140–154. https://doi.org/10.5032/jae.2014.05140

The Agricultural Experience Tracker. (2017). Agricultural education online recordkeeping system. Author. https://www.theaet.com

The Agricultural Experience Tracker. (2023a). What is AET? Author. https://theaet.com/WhatIsAET

The Agricultural Experience Tracker. (2023b). AET in the classroom. Author. https://theaet.com/ClassroomResources

The National Council for Agricultural Education (2015). Career ready practices. https://ffa.app.box.com/s/n6jfkamfof0spttqjvhddzolyevpo3qn/file/294154473359

The National Council for Agricultural Education (2011). Supervised agricultural experience (SAE) philosophy and guiding principles. https://thecouncil.ffa.org/sae/

Thorton, K., E., Easterly, R. G., III., & Simpson, K. A. (2020). Curricular resource use and the relationship with teacher self-efficacy among New Mexico school-based agricultural education teachers. Journal of Agricultural Education, 61(4), 343–357. https://doi.org/10.5032/jae.2020.04343

Toombs, J. M., Eck, C. J., & Robinson, J. S. (2022). The impact of a project-based learning experience on the SAE self-efficacy of pre-service teachers. Journal of Agricultural Education, 63(1), 29–46. https://doi.org/10.5032/jae.2022.01029

Totenhagen, C. J., Casper, D. M., Faber, K. M., Bosch, L. A., Wiggs, C. B., Borden, L. M. (2015). Youth financial literacy: A review of key considerations and promising delivery methods. Journal of Family and Economic Issues, 36, 167–191. https://doi.org/10.1007/s10834-014-9397-0

Walstad, W. B, Rebeck, K., & MacDonald, R. A. (2010). The effects of financial education on the financial knowledge of high school students. The Journal of Consumer Affairs, 44(2), 337–357. https://doi.org/10.1111/j.1745-6606.2010.01172.x

Walumbwa, F. O., Mayer, D. M., Wang, P., Wang, H., Workman, K., & Christensen, A. L. (2011). Linking ethical leadership to employee performance: The roles of leader-member exchange, self- efficacy, and organizational identification. Organizational Behavior and Human Decision Processes, 115(2), 204–213. https://doi.org/10.1016/j.obhdp.2010.11.002 

Warren, J. N., Luctkar-Flude, M., Godfrey, C., & Lukewich, J. (2016). A systematic review of the effectiveness of simulation-based education on satisfaction and learning outcomes in nurse practitioner programs. Nurse Education Today, 46, 99–108. https://doi.org/10.1016/j.nedt.2016.08.023

Wiersma, W., & Jurs, S. G. (1990). Educational measurement and testing (2nd ed.). Allyn and Bacon.

Wilson, C., Woolfson, L. M., & Durkin, K. (2020). School environment and mastery experiences as predictors of teachers’ self-efficacy beliefs towards inclusive teaching. International Journal of Inclusive Education, 24(2), 218–234. https://doi.org/10.1080.13603116. 2018.1455901 

Woolfolk Hoy, A., & Spero, R. B. (2005). Changes in teacher efficacy during the early years of teaching: A comparison of four measures. Teaching and Teacher Education, 21(4), 343–356. https://doi.10.1016/j.tate.2005.01.007

Determining the Needs of School-Based Agricultural Education Teachers in Oklahoma

Kayla N. Marsh, Oklahoma State University, Kayla.marsh@okstate.edu

Kris R. L. Rankin III, Oklahoma State University, Kris.rankin@okstate.edu

Christopher J. Eck, Oklahoma State University, Chris.eck@okstate.edu

Nathan A. Smith, Oklahoma State University, Nathan.smith@okstate.edu

PDF Available

Abstract

Teacher attrition has reached critical levels in the US and globally, with one in every four teachers not remaining in the profession past year three. For 32 years, research surrounding school-based agricultural education (SBAE) teacher needs has been studied, finding that program management, administrative tasks, public relations, SAE development, instructional technology, behavior management, and work-life balance have been recurring needs, yet nothing has been done to proactively address these needs to increase job satisfaction. One-size-fits-all professional development, training, and workshops are ineffective at providing the human capital development needed to meet these needs. The Conceptual Model of Support for SBAE Teachers guided this study in determining the current needs of SBAE teachers in Oklahoma through the distribution of a 42-item instrument. Thirty-six of the 42 items achieved a mean score indicating a need. A statistically significant difference was found between SBAE teachers’ self-reported need scores based on the personal and professional characteristics of participants. It is recommended that purposeful professional development in-service and practical resources be developed to address the unique and specific needs of SBAE teachers.

Introduction and Review of Literature

Teacher attrition has reached critical levels in the US and globally, with one in every four teachers not remaining in the profession in the past year three (OECD, 2021). Attrition rates increase for teaching positions with greater responsibilities like special education, science, technology, engineering, and mathematics (STEM), and agricultural education (Nguyen & Springer, 2019). Since 1917, school-based agricultural education (SBAE) has reported a lack of teachers to meet program demands (Eck & Edwards, 2019). Further exacerbating the concerns was the large percentage of SBAE teachers approaching retirement and early-career SBAE teachers not remaining in the profession to retirement (Smith et al., 2018). Begging the question: How do we make actionable changes to this trend and increase SBAE teacher career retention?

For 32 years, research surrounding SBAE teacher needs has found program management, administrative tasks, public relations, SAE development, instructional technology, behavior management, and work-life balance as recurring needs, yet nothing has been done to address these needs to increase job satisfaction proactively (DiBenedetto et al.,2018; Doss et al., 2022; Shoulders et al., 2021). These historic gaps in specific human capital skills and community networks have been further compounded by the stress and anxiety SBAE teachers face while attempting to manage a complete program (Marsh et al., 2023; Shoulders et al., 2021).

Nationally, school district policies have adopted measures to alternatively and emergency-certify teachers to help alleviate the pressure of filling positions with quality professionals (NCES, 2018; US Department of Education [USDOE], 2016). Emergency certified teachers represent 1% of the teaching population in Oklahoma, as this number has risen from 32 individuals in 2011 to over 3,000 with emergency credentials in 2019 (NCES, 2018; Oklahoma State Department of Education [Oklahoma DOE], 2022; US Department of Education, 2016). Leaving novice emergency teachers facing barriers that limit their effectiveness if they do not receive content, pedagogy, and experience before being placed in the classroom (Mobra & Hamlin, 2020).

Alternatively and emergency certified teachers can be presented with unique challenges, just as other personal and professional characteristics of SBAE teachers contribute to differences in an individual’s level of need (Marsh et al., 2023). For example, female SBAE teachers have identified SAE and FFA tasks to be high-stress responsibilities, with 60% finding that proficiency application preparation and 57% finding that FFA Banquet planning were high to very highly stressful events (King et al., 2013). In addition, classroom responsibilities like reports and paperwork were found to be highly stressful by 57% of female SBAE teachers (King et al., 2013). Teacher age and career tenure seem to reduce the stress level reported by female SBAE teachers, although Smalley and Smith (2017) found time to be a major stressor for individuals trying to balance work and life responsibilities.

According to Huberman’s (1989) teacher career cycle model, the early-career, mid-career, and late-career phases have distinctive characteristics that influence teachers’ needs. Early-career SBAE teachers are characterized by survival and discovery, motivating them to abandon their personal boundaries to succeed in the profession and limiting their work-life/balance, leaving them to struggle in silence (Huberman, 1989; Steffy & Wolfe, 2001; Traini et al., 2020). While the mid-career phase is the most extensive of career phases, characterized by stabilization, experimentation, reassessment, and self-doubt influenced by teachers’ reflection on their progression within the profession. Obstacles identified during the mid-career phase include lack of time, work-life balance, content and curriculum resources, professional development, and networking to improve and energize practice (Huberman, 1989; Smalley & Smith, 2017; Steffy & Wolfe, 2001). Late-career teachers have been characterized by serenity, conservatism, or disengagement, with the need to find meaningful ways to engage and challenge themselves to continue growing (Huberman, 1989; NAAE, 2015; Steffy & Wolfe, 2001). These personal and professional characteristics make each SBAE teacher unique, resulting in varying needs to be successfully retained within the profession (Marsh et al., 2023). Furthermore, Klassen and Chiu (2010) found that one-size-fits-all professional development, training, and workshops are ineffective at providing the human capital development needed to meet these needs. Considering the disparity between SBAE teachers’ unique needs, how do we adequately support these teachers to retain them throughout their careers?

Theoretical/Conceptual Framework

The conceptual model of support for SBAE teachers was developed to provide a human lens for evaluating 21st Century program needs (Marsh et al., 2023; see Figure 1). The framework (see Figure 1) integrates Maslow’s hierarchy for teachers (Fisher & Royster, 2016), the three-component model for agricultural education (FFA, n.d.), and the effective teaching model for SBAE teachers (Eck et al., 2019), providing researchers a lens to evaluate the level of SBAE teachers needs within their professional roles and responsibilities to provide opportunities to develop their career-specific human capital (i.e., education, training, skills, and experiences), ultimately increasing job satisfaction and career retention (Eck et al., 2019; Heckman, 2000; Smith, 2010). Evaluating SBAE teachers’ individual needs based on personal and professional characteristics can influence professional development opportunities, resources, tools, and skills being developed and implemented to make a more impactful change and satisfy the needs of SBAE teachers (Marsh et al., 2023; DiBenedetto et al., 2018; Klassen & Chiu, 2010).  

Figure 1 

Conceptual Model of Support for School-Based Agricultural Education Teachers  

Chart

Description automatically generated

Purpose and Objectives

The purpose of this study was to determine the current needs of SBAE teachers in Oklahoma. The research questions guiding this study were:

1) What are the 21st Century needs of SBAE teachers in Oklahoma, and

2) Do needs differ based on SBAE teachers’ personal and professional characteristics?  

Methods

SBAE teachers in Oklahoma attending area Chapter Officer Leadership Training (COLT) conferences hosted by the Oklahoma FFA Association (n = 372) served as the accessible population (Privitera, 2020) for this study. The instrument was developed utilizing a previously validated list of 42-items representing the perceived needs of 21st Century SBAE teachers. The instrument was established by an expert panel of SBAE supporters using a three-round Delphi approach (Marsh et al., 2023). The instrument was adapted to include a four-point Likert-type scale ranging from strongly disagree (1) to strongly agree (4), based on the recommendations of (Marsh et al., 2023). SBAE teachers attending the COLT conferences were asked to scan a QR code to complete the survey questionnaire, of which 121 teachers completed the instrument, resulting in a 34% response rate.

SPSS Version 25 was used for the data analysis of this study. Data were exported to an SPSS compatible file that would allow for descriptive statistics and the analysis of variance (ANOVA) tests to be run comparing different variables from the study. The main comparable variables considered for analysis were (1) gender, (2) career stage, (3) total need score, and (4) need score mean. An ANOVA and normality of distribution were conducted on the data, resulting in not normally distributed data with unequal variances. Therefore, a Kruskal-Wallis test and a Welch test were run to identify if the significance of these findings would hinder the data usage for ANOVA tests (Field, 2018). Both tests were found not to be significant for the gender and career phase, indicating that the data was fit to have ANOVA tests and the Tukey-Kramer Post Hoc analysis conducted (Field, 2018). Regional responses and certification held by the participants indicated unequal tests of normality and homogeneity of variances, indicating the need to run the Games-Howell Post Hoc test to adjust the data for these unequal data points (Field, 2018).

The personal and professional characteristics of participants are outlined in Table 1. Career phases were broken down into early (1 to 6 years; n = 60), mid (7 to 15 years; n = 30), and late-career (16 or more years; n = 38), based on the recommendations of Huberman (1989).

Table 1 
Personal and Professional Characteristics of Participants (n = 121)

Characteristicf%
GenderFemale 4537% 
 Male 76 62%
    
Career phaseEarly Career (0 – 6 years) 5948% 
 Mid-Career (7 – 15 years) 3125% 
 Late Career (16 – 39 years)  31 25%
    
Certification pathwayTraditional 108108
 Alternative 1111
 Emergency 22
    
Region of OklahomaRegion I 3226%
 Region II 4335%
 Region III 119%
 Region IV 2218%
 Region V 1310%

For the total need score, the 42 items were each ranked on a four-point scale of agreement, with all items being weighted equally, as McDonald (1997) recommended equally weighted summative scores to be optimal when analyzing multiple components, as no weighted method can provide a better estimate. Therefore, total need scores had a potential range of 42 (little or no need) to a maximum of 168 (high need). It is recommended that individual item mean scores be considered as follows: 1.0 to 1.5 (not a need), 1.6 to 2.0 (low need), 2.1 to 2.5 (somewhat need), 2.6 to 3.0 (moderate need), 3.1 to 3.5 (high need), and 3.6 to 4.0 (essential need).

ANOVA tests and post-hoc analysis consisting of (1) gender v. total need score mean, (2) teaching certification vs. total need score mean, (3) career phase v. total need score mean, and (4) Oklahoma teacher association region vs. total need score mean were conducted to address the second research question. Two Post-hoc analyses were used in the ANOVA comparisons. A Tukey-Kramer test was used when group sizes were found to be normally distributed and have equal variances (i.e., gender and career phase), while the Games-Howell test was conducted for group sizes that did not have normally distributed data and was found to have unequal variances to account for the disparities in the normality and variances of the data (e.g., teaching certification and Oklahoma teaching association region), allowing for a more accurate analysis of the data when comparing abnormal group sizes to different variables being studied (Field, 2018). 

Findings

Research question one sought to determine the current needs of SBAE teachers in Oklahoma. With an overall mean of 3.16 across the 42-items, there is a perceived need from Oklahoma SBAE teachers (see Table 1). Thirty-six of the 42-items had a mean need score of 3.00 or higher (i.e., moderate to high need), with the remaining six items falling below 3.0 mean score (moderate need). The identified items representing the greatest need included (1) access to essential resources (3.50), (2) curriculum resources (3.50), (3) support from local school administration (3.48), (4) work-life balance (3.46) and (5) respect (3.37) with a statistical power of 0.99. The effect size for the top five identified items ranged from 0.50 to 0.44. The lowest perceived needs included training on effective online delivery techniques (2.91),support for hybrid teaching (2.87), pedagogical content knowledge (2.87), diversity, equity, and inclusion (DEI) training (2.78), and lesson planning training (2.72). The effect size of the bottom five identified items ranged from 0.20 to 0.11.         

Table 2 
Current Needs of SBAE Teachers In Oklahoma (n = 121)  

Identified NeedMSD
Identified Need  MSD
Access to essential resources  3.50.55
Curriculum resources   3.50.59
Support from local school administration    3.48.70
Work-life balance    3.46.67
Respect    3.37.75
Purposeful professional development   3.34.57
Assistance/resources for training FFA teams  3.34.61
Parent support    3.33.69
State level support   3.32.64
Community support    3.31.72
Classroom/Laboratory Support    3.30.57
FFA Support    3.26.66
Identified Need  MSD
Skills and techniques for working with students with special needs   3.26.57
Resources to help students overcome various levels of public speaking anxiety   3.26.65
Assistance/resource to develop FFA officer teams  3.26.61
Relevant evaluations that reflect their complete program   3.23.73
Their planning period (i.e., not being required to cover other classes/duties during this time)  3.22.82
Resources to recruit traditional and non-traditional ag students   3.18.72
Agricultural mechanics skills   3.17.62
Resources to integrate experiential learning opportunities for students   3.16.63
Resources for awarding and recognizing SAEs   3.16.73
Resources on FFA integration within a complete program (i.e., Program of Activities, National Chapter Award, Proficiency Awards)    3.15.71
Accessibility training   3.14.67
Laboratory safety resources   3.13.68
Classroom management skills   3.12.66
Agricultural content knowledge   3.12.71
Greenhouse management skills   3.12.75
Support for teacher mental health    3.11.77
Training of “SAE for ALL” implementation   3.11.75
Support to aligning lab facilities to program curricula   3.09.68
SAE Support    3.08.53
Tools to address student mental health issues   3.07.70
Support in providing equal opportunities to all students   3.04.72
Support to identify student mental health issues    3.03.67
Emotional health support     3.01.78
Laboratory management training    3.00.72
Training to implement a variety of formative evaluation techniques   2.98.66
Training on effective Online delivery techniques    2.91.76
Support for hybrid teaching (i.e., in-person, virtual, simultaneous)   2.87.84
Pedagogical content knowledge   2.87.77
Diversity, equity, and inclusion (DEI) training   2.78.90
Lesson planning training    2.72.88

Note. Strongly Disagree = 1, Disagree = 2, Agree = 3, and Strongly Agree = 4. 

The second research question aimed to determine if SBAE teachers’ needs differed based on their personal and professional characteristics. Composite needs scores had a potential range from a low of 42 to a high of 168, which were compared to each of the personal and professional characteristics (i.e., gender, career phase, certification pathway, and regions of Oklahoma).

Females (n = 45) had a higher mean need score of 135.7 compared to male respondents (n = 76) at 117.5. This finding was statistically significant, with the lower bound of the 95% confidence interval for female respondents at 127.3 compared to the upper bound for male respondents at 125.4. Due to the gap in the identified need score range between males and females, there was a statistically significant difference in the need scores between genders F (2,150) = 122.034, p<.05. Four of the top five needs items were found to be similar for both males and females, with females identifying purposeful professional development and males identifying respect and their fifth need (see Table 3).

Table 3
Identified Needs by Gender (n =121)  

GenderIdentified NeedMSD
Female RespondentsSupport from local school administration  3.48.72
 Access to essential resources 3.44.54
 Work-life balance  3.44.62
 Curriculum resources 3.43.62
 Purposeful professional development 3.40.53
   
Males RespondentsCurriculum resources 3.54.57
 Access to essential resources  3.52.52
 Work-life balance 3.50.64
 Support from local school administration 3.47.70
 Respect 3.44.72

Analysis by career phase showed that early-career teachers had a higher mean need score of 131.8 and a need score range of 123.4 to 140.1, followed by mid-career teachers with a mean score of 127.7 and a need score range of 116.2 to 139.2, and late-career teachers with a mean score of 106.4 and a need range of 92.8 to 119.9. It was found that the maximum need score of the late-career teacher and the minimum score of the early-career teachers had a gap of 3.5 points. Due to this gap in need score means, early-career teachers were found to be statistically different when compared to late-career teachers (F (3,149) = 74.389, p < .05). Comparing early-career to mid-career and mid-career to late-career showed no statistical difference.

All career phases identified access to essential resources and curriculum resources in the top five identified needs. The early-career teachers had further overlapping identified need for work-life balance being shared with mid-career teachers and support from local school administration shared with late-career teachers. A total of nine unique needs items were found as the top five needs regardless of career phase (see Table 4)

Table 4
Identified Needs by Career Phase (n = 121)

Career PhaseIdentified Need  MSD
Early-careerWork-life balance  3.58.67
 Access to essential resources 3.57.53 
 Curriculum resources  3.56.56 
 Support from local school administration 3.52.75 
 Classroom/Laboratory support 3.47.53 
      
Mid-careerCurriculum resources  3.61.49 
 Work-life balance 3.51.56 
 Access to essential resources  3.45.56 
 Purposeful professional development 3.41.50 
 State level support 3.38.61 
      
Late-careerSupport from local school administration  3.54.62 
 Access to essential resources 3.38.49 
 Assistance/resources for training FFA teams  3.30.53 
 Respect 3.30.79
 Curriculum resources 3.29.69

Further analysis was warranted to identify the top five needs of the three teaching certifications held by the participants (see Table 5). Traditionally certified teachers were found to have a total need score mean of 125.02 with a range from 90.00 to 168.00 points. Alternatively, certified teachers were found to have a total need core mean of 126.58 with a range from 116.00 to 168.00 points. Emergency certified teachers had a total need score mean of 138.00, ranging from 136.00 to 140.00 points (see Table 5). After analysis of the one-way ANOVA, it was found that differences in total need score mean and the certification type held by the participants were not statistically significantly different (F (1,1) = .540, p > .05).

Analysis by teacher certification pathway showed all participants addressed their top five needs between agree and strongly agree. Emergency certified teachers indicated strongly agree for their top five identified needs. However, it should be noted that there were only two emergency certified teachers among the participants, indicating both participants strongly agreed (a score of 4 on the instrument) for their top five needs. Two items were found to have been a top five need within all three certification groups i.e., support from local school administration and work-life balance. An additional two items were found in at least two certification groups, i.e., respect (alternatively and emergency certified teachers) and access to essential resources (alternative and traditionally certified teachers; see Table 5).

Table 5
Identified Needs by Certification Pathway (n = 121)

Certification PathwayIdentified Need  MSD
Alternatively CertifiedSupport from local school administration  3.63.50
 Their planning period (i.e., not being required to cover other classes/duties) 3.54.52
 Respect  3.54.52
 Work-life balance 3.54.52
 Access to essential resources A 3.45.52
     
Emergency CertifiedCommunity support  4.00.00
 Parent support 4.00.00
 Support from local school administration  4.00.00
 Respect 4.00.00
 Work-life balance 4.00.00
     
Traditionally CertifiedCurriculum resources  3.51.55
 Access to essential resources 3.50.52
 Work-life balance  3.46.64
 Support from local school administration 3.45.72
 Assistance/resources for training FFA teams 3.34.63

Note. Alternatively certified teachers were teachers who previously held a college degree and passed the Oklahoma agricultural education teaching examination. Emergency certified teachers were self-identified to have been emergency-certified based upon Oklahoma Department of Education standards. Traditionally certified teachers were teachers who attended an institution(s) that prepared agricultural education teacher educators and successfully met all requirements for degree completion and teacher certification in agricultural education. AAlternatively certified participants identified eight needs with the same need score mean and standard deviation. The fifth item listed in Table 5 was the first identified in instrument order, followed by parent support, classroom/laboratory support, support in providing equal opportunities to all students, agricultural mechanics skills, resources for awarding and recognizing SAEs, resources to help students overcome various levels of public speaking anxiety and assistance/resource to develop FFA officer teams.

The five regions represent the Oklahoma FFA association and are identified by their geographical location within the state. Region I had 32 responses to the instrument with a total need score mean of 126.50, while Region II had 43 responses and a total need score mean of 126.60, Region III with 11 responses and a total need score mean of 118.08, Region IV with 22 responses and a total need score mean of 133.91, and Region V with 13 responses with a total need score mean of 137.77, respectively. After analysis of the regional total need score means and performing a one-way ANOVA test, it was found that the regional total mean need scores were not statistically significantly different between the regions (F (2,2) = 5.405 p > .05).

Four items (i.e., access to essential resources, curriculum resources, support from local school administration, and work-life balance) were found to have been identified as a top five need in at least four of the regions. Three items (i.e., respect, community support, and accessibility training) were found to have been identified as a top five need in two of the regions. Nineteen unique items were found as a top five need item in at least one Oklahoma region (see Table 6).

Table 6
Identified Needs by Region of Oklahoma (n = 121)

Region of OklahomaIdentified Need  MSD
Region ICurriculum resources  3.71.45
 Access to essential resources 3.56.50
 Parent support  3.53.71
 Support from local school administration 3.46.76
 State level support 3.43.71
     
Region IIAccess to essential resources  3.46.50
 Work-life balance 3.45.67
 Support from local school administration  3.41.73
 Respect 3.38.62
 Purposeful professional development 3.37.57
     
Region IIIWork-life balance  3.45.68
 Support from local school administration 3.36.67
 Access to essential resources  3.27.46
 Respect 3.27.90
 Community SupportA 3.18.40
     
Region IVSupport from local school administration  3.81.39
 Curriculum resources 3.66.48
 Access to essential resources  3.63.49
 Work-life balance 3.63.58
 Community support 3.61.49
     
Region VClassroom/Laboratory support  3.53.51
 Work-life balance 3.53.51
 Tools to address student mental health issues  3.53.51
 FFA support 3.46.51
 Skills and techniques for working with students with special needsB 3.46.51

Note. ARegion III participants had seven items identified with the same need score mean. The fifth item listed in the table above had the lowest standard deviation, followed by 1. their planning period (i.e., not being required to cover other classes/duties), 2. curriculum resources, 3. agricultural content knowledge, 4. resources to help students overcome various levels of public speaking anxiety, 5. assistance/resource to develop FFA officer teams, and 6. assistance/resource for training FFA teams. BRegion V participants had three items with the same need score mean and standard deviation. The fifth item listed in Table 6 is the first identified in instrument order, followed by 1. accessibility training and 2. curriculum resources.

Conclusions, Implications, and Recommendations

Twenty-nine of the 42 items achieved a mean indicating a high need (i.e., mean score above 3.1) for SBAE teachers in Oklahoma, the remaining 13 items resulted in a moderate need. The top two items included access to essential resources, and curriculum resources, aligning to an ongoing need for content, curriculum, and practical resources to support their programs (Doss et al., 2022). The needs identified by SBAE teachers also reflected the importance of relationships with parents, administration, community, and state-level supporters in the surrounding school community to provide resources and meet program needs (Marsh et al., 2023; Doss et al., 2022). In addition, items such as support from local school administration, work-life balance, and respect represent the human need to establish relationships, boundaries, and a level of respect within their professional role as SBAE teachers (Marsh et al., 2023; Shoulders et al., 2021). Perhaps to better address the subsistent and security needs (Marsh et al., 2023) of current Oklahoma SBAE teachers, a more effective lens is necessary to create actionable change?

A statistically significant difference was found in SBAE teachers’ self-reported need scores based on personal and professional characteristics of participants (F (3,149) = 74.389, p < .05). Early-career SBAE teachers participants corresponded with a higher percentage of female SBAE teachers in the Oklahoma, which represented the population of participants with higher self-reported need scores. While this finding was statistically significant, it also speaks to the practical significance of developing professional development training, curriculum resources, and instructional tools that meet the individual personal and professional characteristics of Oklahoma SBAE teachers. Further connecting to the need to evaluate teachers through a human lens using the conceptual model of support for SBAE Teachers (Marsh et al., 2023).

When considering the needs identified by personal and professional characteristic subgroups, males had a grand mean need score lower than female respondents, but males’ need scores for the top five items were higher than that of the female respondents. This suggests that the top items identified were significant high needs impacting males in the profession. Males differed in the top five responses from females with respect to replacing purposeful professional development. Perhaps this was an impacting factor for males not entering or being retained in the profession because it was no longer aligning with their individual human needs to feel respected within the profession (Marsh et al., 2023). In addition, female respondents reported a higher grand mean score reflecting their increase in identified needs, which was supported by the fifth item, purposeful professional development, as the recognition of future human capital development to support their practice within the profession was essential (Eck et al., 2019; Marsh et al., 2023).

Early-career teachers were found to have statically significant needs when compared to the needs of late-career teachers by the grand mean score, but they still shared three of the top five needs, including access to essential resources, curriculum resources, and support from local school administration. Traini et al. (2020) concluded that early-career teachers’ stress as they strive to achieve stability in their personal and professional careers and struggle in silence, but the review of identified needs by career phases suggests that they share needs with mid and late-career SBAE teachers. Even with early-career teachers responding with a greater need than mid and late-career teachers, perhaps connecting early-career teachers with mid and late-career teachers could improve connectedness and community by sharing resources and fostering mentorships. Mid-career SBAE teachers had the most overlap between early and late-career teachers, aligning with Huberman’s (1989) teacher career cycle model that this was a critical phase for providing engagement, professional development, and resources targeted to support their career retention.

Reviewing identified needs by certification pathway, emergency certified teachers responded with a need score mean of 4.0 and a standard deviation of 0.00 for community support, parent support, local administration support, respect, and work-life balance. The findings align with Mobra and Hamlin (2020) that emergency-certified teachers lack the support and resources needed to improve their practice and overcome the barriers to becoming successful in the classroom. Further, the needs identified by emergency and alternately certified teachers were relational focus suggesting a need for belonging within the profession through community, mentorship, and networking (Marsh et al., 2023). Interestingly, traditionally certified teachers identified as needing resources and training FFA teams may be a product of their own FFA interests, self-efficacy in pedagogy, or interest in engaging and improving leadership teams and events.

The regions of the Oklahoma had similarly identified the top five needs for access to essential resources, curriculum resources, support from local school administration, and work-life balance, which was also reflected by the overall top five identified items, suggesting that the regional and state identified needs align and that no region had a significant gap of resources. This was further confirmed by the statistical power of the study 0.99, and the lack of significant differences between regions (F (2,2) = 5.405 p > .05). Unique to region V was the identified need for skills and techniques for working with students with special needs, whichmay represent a specific gap between schools and school districts within the region.

Practical recommendations from this study included targeting the resource, curriculum, and professional development needs of SBAE teachers based on their unique personal and professional characteristics due to the differences found between female and male respondents as well as between early-career and mid to late-career teachers. It is recommended that instructional tools and curriculum resources be organized in an easy-to-access format and provide a structured plan for ease of implementation for SBAE teachers. Many of the identified needs overlapped between different personal and professional characteristics, which provide the opportunity for mentorship/community development between early, mid, and late-career teachers as well as alternative/emergency certified participants with traditional certified participants. Specifically identified needs as in Region V’s skills and techniques for working with students with special needs and late-career teacher’s assistance/resources for training FFA teams, should be addressed through professional development, communication of tools available, and updated resources targeted specifically to the participants’ needs.

Additionally, professional development opportunities should focus on furthering the human capital of the complete person for SBAE teachers in Oklahoma. Respect and work-life balance represent basic human needs found at the subsistence, security, and belonging level within the conceptual model of support for SBAE (Marsh et al., 2023). Efforts should be made to build relationships, as the sharing of resources and fostering of mentorship between the career phases could help to bridge the identified need gap and increase security in the profession since one-size fits all is not effective for creating the human capital growth needed to overcome the current identified needs (Marsh et al., 2023; Doss et al., 2022; Klassen & Chiu, 2010; Shoulders et al., 2021). Additionally, providing SBAE teachers with the necessary resources to advocate and defend the value of their programs when communicating with parents, administration, and the surrounding community helps to increase a sense of respect and appreciation.

Future research should further investigate the impact of such professional development, including alternatives to one-time professional development workshops. Furthermore, the perceived expectations of SBAE teachers from superintendents and school administrators should be evaluated to potentially address the value, respect, and workload of Oklahoma SBAE teachers. Validation of the conceptual model of support for SBAE should be evaluated as a tool for identifying SBAE teachers’ unique needs and connecting them with actionable resources.

References

DiBenedetto, C. A., Willis, V. C., & Barrick, R. K. (2018). Needs assessments for school-based agricultural education teachers: A review of literature. Journal of Agricultural Education, 59(4), 52–71. https://doi.org/10.5032/jae.20180452

Doss, W., Rayfield, J., & Lawver, D. (2022, February 13–15). Identifying challenges faced by school-based agricultural education teachers [Paper presentation]. Southern Region AAAE Conference, New Orleans, LA. http://aaaeonline.org/resources/Documents/Southern%20Region/2022SouthernConference/2022SouthernAAAE_ResearchProceedings.pdf

Eck, C. J., & Edwards, M. C. (2019). Teacher shortage in school-based, agricultural education (SBAE): A historical review. Journal of Agricultural Education, 60(4), 223–239. https://doi.org/10.5032/jae.2019.04001

Eck, C. J., Robinson, J. S., Ramsey, J. W., & Cole, K. L. (2019). Identifying the characteristics of an effective agricultural education teacher: A national study. Journal of Agricultural Education, 60(4), 1–18. https://doi.org/10.5032/jae2019.04001

Field, A. (2018). Discovering statistics using IBM SPSS statistics (5th ed.). SAGE.

Fisher, M. H., & Royster, D. (2016). Mathematics teachers’ support and retention: Using Maslow’s Hierarchy to understand teachers’ needs. International Journal of Mathematics Education in Science and Technology, 47(7), 993–1008. https://doi.org/10.1080/0020739X.2016.1162333

Heckman, J. J. (2000). Policies to foster human capital. Research in Economics, 54(1), 3–56. https://doi.org/10.1006/reec.1999.0225

Huberman, M. (1989). The professional life cycle of teachers. Teachers College Record, 91, 31– 57. https://doi.org/10.1177/016146818909100107

King, D., Rucker, K. J., & Duncan, D. W. (2013). Classroom instruction and FFA/SAE responsibilities creating the most stress for female teachers in the southeast. Journal of Agricultural Education, 54(4) 195–205. http://doi.org/10.5032/jae.2013.04195

Klassen, R. M., & Chiu, M. M. (2010). Effects on teachers’ self-efficacy and job satisfaction:       Teacher gender, years of experience, and job stress. Journal of Educational Psychology,           102(3), 741–756. http://doi.org/10.1037/a0019237 

Marsh, K. N., Eck, C. J., Layfield, K. D. & Donaldson, J. L. (2023). Identifying school-based agricultural education teacher needs and support gaps. Advancements in Agricultural Development, 4(3), 117 –130. https://doi.org/10.37433/aad.v4i3.347 

Mobra, T., & Hamlin, D. (2020). Emergency certified teachers’ motivations for entering the teaching profession: Evidence from Oklahoma. Education Policy Analysis Archives, 28(109) 1–29. https://doi.org/10.14507/epaa.28.5295

National Association of Agricultural Educators [NAAE]. (2015). Ag teacher’s life cycle. http://www.naae.org/lifecycle/index.cfm

National Center for Education Statistics [NCES]. (2018, May). Characteristics of public school teachers who completed alternative route to certification programs [Annual reports]. The condition of education. U.S. Department of Education, Institute of Education Sciences. https://nces.ed.gov/programs/coe/indicator_tlc.asp

Nguyen, T. D., & Springer, M. G. (2019). Reviewing the evidence on teacher attrition and retention. Brookings. https://www.brookings.edu/blog/brown-center-chalkboard/2019/12/04/reviewing-the-evidence-on-teacher-attrition-and-retention/ 

Oklahoma State Department of Education [Oklahoma DOE]. (2022). State Board of Education – Approved emergency certification applications [Reports]. https://sde.ok.gov/documents/2017-09-13/emergency-certifications

Organization for Economic Co-operation and Development [OECD]. (2021). The state of school education: One year into the COVID Pandemic [Reports]. https://doi.org/10.1787/201dde84-en

Privitera, G. J. (2020). Research methods for the behavioral sciences. SAGE.

Shoulders, C. W., Estepp, C. M., & Johnson, D. M. (2021). Teachers’ stress, coping strategies, and job satisfaction in COVID-induced teaching environments. Journal of Agricultural Education, 62(4), 67–80. https://doi.org/10.5032/jae.2021.04067

Smalley, S. W. & Smith, A. R. (2017). Professional development needs of mid-career agriculture teachers. Journal of Agricultural Education, 58(4), 282–290. https://doi.org/10.5032/jae.2017.04282

Smith, E. (2010). Sector–specific human capital and the distribution of earnings. Journal of Human Capital, 4(1), 35–61. https://doi.org/10.1086/655467

Smith, A. R., Lawver, R. G., & Foster, D. D. (2018). National agricultural education supply and demand study: 2017 executive summary. http://aaeonline.org/Teacher–Supply–and– Demand/

Steffy, B. E., & Wolfe, M. P. (2001). A life-cycle model for career teachers. Kappa Delta Pi Record, 38(1), 16–19. https://doi.org/10.1080/00228958.2001.10518508

The National FFA Organization [FFA]. (n.d.). The National FFA Handbook. https://www.ffa.org/agricultural-education/

Traini, H. Q., Yopp, A. M., & Roberts, R. (2020). The success trap: A case study of early career agricultural education teachers’ conceptualizations of work-life balance. Journal of Agricultural Education, 61(4), 175–188. http://doi.org/10.5032/jae.2020.04175

US Department of Education [USDE]. (2016). Prevalence of teachers without full state certification and variation across schools and states. https://www2.ed.gov/rschstat/eval/teaching/teachers-without-certification/report.pdf

Effectiveness of Online Program Engagement for 4-H Members during the Covid-19 Pandemic

Lauren B. Hood, Clemson University, eburdin@clemson.edu

Christopher J. Eck, Oklahoma State University, Chris.eck@okstate.edu

K. Dale Layfield, Clemson University, dlayfie@clemson.edu

Joseph L. Donaldson, North Carolina State University, Joseph_donaldson@ncsu.edu

PDF Available

Abstract

Since 1902, 4-H Youth Development programs have been implemented by Cooperative Extension Agents or Educators for teaching, influencing, and leading youth to new life skills that can shape and influence their futures through hands-on learning methods. Fast forward to 2020 when 4-H programs shifted to virtual methods during the COVID-19 pandemic. The purpose of this study and the overarching research question was to identify the perceptions of participants and their parent/guardian related to the virtual 4-H programming opportunities available to youth in South Carolina during the COVID-19 pandemic. This qualitative inquiry was undergirded by the need for achievement theory. Focus group interviews of South Carolina 4-H participants revealed two overarching themes, including communication (before and during COVID-19) and impacts on involvement and retention. Overall, the majority of families interviewed for this study were pleased with their 4-H agent and volunteer’s impact and levels of communication during and post-COVID-19. State 4-H leaders are not only recommended, but highly encouraged, to establish best practices for virtual 4-H programming.

Introduction

Cooperative Extension Services across the United States serve their respective states by offering unbiased, research-based education to audiences young and old (Monks et al., 2017). Cooperative Extension serves as the essential connection between the land-grant university and the public, requiring extension professionals to localize programs and adapt to the needs of their constituents (Cooper & Graham, 2001). “In the last decade, Cooperative Extension has rapidly diversified its portfolio in many ways to respond to the needs of people in our rapidly changing society, including adapting to online learning environments and ‘the cloud’” (Gould et al., 2014, para. 7). One of the most important needs to date was navigating through the COVID-19 pandemic.

Before COVID-19-related closures, 4-H groups and clubs were led by volunteers or 4-H professionals and met in various locations, at varying times to engage, study and practice, or for fellowship and celebration (Burnett et al., 2000). With the COVID-19 pandemic shut down of schools, educators and parents were not prepared to quickly provide hands-on learning activities to complete at home (Loose & Ryan, 2020). Cooperative Extension services nationwide quickly and efficiently created virtual solutions and alternatives to offset the lack of in-person programming (Arnold & Rennekamp, 2020). Cooperative Extension has been challenged to deliver relevant programs with measurable end-results to its audiences (Gould et al., 2014), but how can this be accomplished during a pandemic?  The pandemic created unique challenges and obstacles for all 4-H professionals and volunteers. These dedicated adults were required to be intrinsically and extrinsically motivated (Calvert & Fabregas Janeiro, 2020) to overcome said challenges and obstacles. Grégoire (2004) noted dedicated 4-H professionals and volunteers can quickly adjust to changing needs. These quick-thinking professionals and volunteers were put to the test during the pandemic. Non-parental adults, or adults who serve in volunteer leader capacities described by McNeill (2010), helped provide 4-H programming opportunities to youth via virtual platforms and take-home kits once local Extension offices closed due to the pandemic.

These programming opportunities were meant to aid at-home learning with hands-on activities that, in most cases, were aligned with school standards and to promote positive youth development (PYD); Extension professionals had to learn how to integrate new technologies (e.g., “Zoom”) to engage their stakeholders and provide purposeful educational opportunities (Eck et al., 2022). COVID-19 impacted PYD, including trauma, isolation, the loss of relationships, daily routines, and social outlets to name a few (Arnold & Rennekamp, 2020). With the knowledge of these impacts, Extension professionals strived to remain “consistent with [the] mission of positive youth development, [as] the 4-H program is uniquely positioned to address and mitigate COVID-19 impacts on youths by focusing on building youth assets and providing supportive contexts” (Arnold & Rennekamp, 2020, para. 10). 

It has been recommended that additional research is essential “to gather feedback from parents and members on their perceptions of their own states’ programming efforts during the COVID-19 pandemic” (Hood, 2021, p. 15). Therefore, this study aimed to uncover the perceptions of those participating, specifically, 4-H youth and parents/guardians, in virtual 4-H programming opportunities in South Carolina during the COVID-19 pandemic. This study also yields recommended best practices for future virtual programming. In Gordon and Curlee’s (2011) book, The Virtual Project Management Office: Best Practices, Proven Methods, the authors state, “all organizations must have processes and procedures based on best practices to enhance their chances of success” (p. 109). Several of the best practices recommended revolve around communication with and without Internet access.

Theoretical/Conceptual Framework

McClelland’s (1987) need for achievement theory undergirded this study. This theory of motivation (McClelland, 1987) is associated with learning concepts, where needs are learned through coping environments (Pardee, 1990). The theory outlines three motivating factors; the need for achievement, the need for affiliation, and the need for power (Gill et al., 2010). The need for achievement is associated with personality characteristics such as strong goal setting, taking calculated risks, appreciating feedback, and preferring to work alone (McClelland, 1987). On the other hand, the need for affiliation corresponds with someone who wants to be part of the larger group, is often considered a follower, prefers collaboration, and avoids risk (McClelland, 1987). Finally, someone who likes to win, wants to control situations, enjoys competition, and thrives on recognition aligns with the need for power (McClelland, 1987). These motivating factors associated with McClelland’s (1987) work stem from the theory of needs established by Maslow in the 1940s.

According to McClelland (1987), the three motivating factors exist inherently regardless of gender, age, or culture, but the dominating factor is often one’s life experiences. The need for achievement theory has been implemented in 4-H studies addressing the participation and retention of members (Baney & Jones, 2013; Gill et al., 2010). Based on previous use of the theory, it aligns with this study to explore 4-H member participation and engagement during the COVID-19 pandemic. 

Purpose

This study explored if virtual programming during the COVID-19 pandemic provided vital engagement opportunities for 4-H youth. Realizing that Extension professionals received just-in-time training to learn new technologies to overcome communication challenges (Eck et al., 2022), their efforts to provide those engagement opportunities for 4-H members were investigated.

Methods

This exploratory qualitative research study (Price, et. al, 2018) implemented a case study design using focus groups to further evaluate the impact of the COVID-19 pandemic on 4-H youth in South Carolina. This qualitative inquiry was developed based on previous survey research recommending a deeper dive into the perceptions of 4-H youth and families during the COVID-19 pandemic (Hood, 2021). Therefore, the research team constructed a flexible qualitative interview protocol, consisting of a series of seven overarching questions and talking points to discuss with participants to provide deep, rich information related to participant perceptions of the virtual 4-H programing in South Carolina. Focus groups were held during July 2021 online via Zoom.

The interview protocol was evaluated for face and content validity (Salkind, 2012) by three faculty members in agricultural and extension education across two universities who have all completed coursework and previous research in qualitative inquiry. An email invitation was sent to families of youth who participated in virtual 4-H programming during the COVID-19 pandemic in South Carolina and provided a follow-up email address. The sampling frame consisted of 1,669 individuals (adults and youth). Four families, which included four adults and seven children, (n = 11) across South Carolina responded to the invitation and were willing to participate in a Zoom focus group interview. These four families represented three of the four regions in South Carolina and had youth enrolled across the three 4-H age brackets (i.e., Cloverbud, Junior, and Senior). Zoom was used to conduct the focus groups, while also allowing for the interviews to be recorded and interview transcriptions to be developed through the platform. Each family was provided a family number to allow proper tracking and triangulation across sources, while also providing anonymity.

After the focus group interviews, the lead researcher reviewed the interview transcripts against the audio/video recording to verify accuracy. The research team then analyzed the data using the constant comparative method (Glasser & Strauss, 1967). The research team used the video recording of each focus group, interview transcripts, and interviewer notes to allow codes, themes, and categories to emerge describing the family’s reality (Creswell & Poth, 2018; Glesne, 2016). In addition to multiple descriptions of data, the research team corroborated to develop the emerging themes, following the recommendations of Creswell and Poth (2018) to improve the accuracy of data analysis through coding checks, establishing reliability of the coding process. Specifically, the constant comparative method was implemented, which allows the data, including the participants voice, to speak for itself (Glasser & Strauss, 1967). Three rounds of coding were implemented starting with open-source coding (Creswell & Poth, 2018). The codes from the first round were then analyzed using axial coding, where the relationships of codes were used to establish categories (Creswell & Poth, 2018; Glasser & Strauss, 1967). The final round implemented selective coding, allowing the overarching themes to emerge as core themes and variables linking back to the conceptual framework established by Gill et al. (2010) which connected to the factors established within McClelland’s (1987) motivational needs theory.

Within a qualitative inquiry it is imperative that the research team aim to address the four criteria provided by Privitera (2017) to ensure trustworthiness (i.e., credibility, transferability, dependability, and confirmability). Using interview transcripts, audio/video recordings, and interviewer field notes allowed the true opinions of the 4-H families to be reflected in the study, which addresses credibility (Privitera, 2017). Although this qualitative inquiry was limited to four families, all families participating in virtual 4-H programming during the COVID-19 pandemic in South Carolina had the opportunity to participate and the families who did participate represented different parts of the state, different 4-H age classifications of the youth (i.e., Cloverbud, Junior, and Senior), and participation in the different virtual programs offered, allowing this data to have transferability across the state. Implementing the focus group style interview with a flexible interview protocol and the varying characteristics of participants allows for consistent data collection (Privitera, 2017). Allowing the perspectives of the families to be represented in the findings and not the researchers bias speaks to the confirmability of this study (Privitera, 2017), which was addressed through the established interview protocol, three round coding process, member checks, and interpretation of data sources.

Reflexivity Statement

Palaganas et al. (2017) suggested that researchers acknowledge their inherent bias related to their study and disclose their identity to offer reflexivity. The research team for this study consisted of a graduate student in agricultural education, who was also an active 4-H youth development educator, along with three faculty members in agricultural and extension education at Clemson University and North Carolina State University. The graduate student had worked in Extension for eight years and was completing a degree in agricultural education at Clemson University. The three faculty members have more than 40 years of experience combined in agricultural and extension education. Overall, the research team recognized their bias toward Extension because of their professional roles and felt they addressed the biases through the established procedures and trustworthiness of the study.

Findings

The focus group interviews were analyzed allowing categories to emerge related to the youth and parents’ perceptions of the virtual 4-H programming offered during the COVID-19 pandemic. The emerging codes and themes resulted in two overarching categories, including communication and 4-H agent/volunteer leader impact.

Category 1: Communication

The first category to emerge throughout was communication. Communication was then divided into two themes: pre-COVID-19 and during-COVID-19 to represent the participants’ perceptions. Family #1 [mom] mentioned they were impressed with the level of communication and the amount of programming offered. They said that it seemed like there were more newsletters sent out and that there was more information within those newsletters compared to before COVID-19. Family #1’s mom wrapped up the conversation with, “you guys have done an off the charts, valiant job with communication when it’s just been such a difficult year.” Family #2 [the parents] detailed how there has been little to no communication on the county level. “Well, it’s been zero communication from the county level, and we have a child serving as a county club officer,” said Family #2’s mom. She also said, “we just feel very really sad because there are so many possibilities under 4-H that are so incredible, so I feel like not only did we lose, and not just because of the pandemic, we didn’t feel like we were part of it anymore.” The few details they had about 4-H activities offered during COVID-19-related closures they found on their own through the state social media pages or the state 4-H website.

Family #2 reported no communication from both their local agent and their local club’s volunteer leader. The family also commented that they had just recruited a new family to join their local group, so it was especially frustrating that this new family joined and received zero information. This was not an issue prior to COVID-19. Family #3 [mom] complimented the marketing strategies and graphics used for marketing throughout the COVID-19 pandemic. Upon seeing a ‘random Facebook ad’ for South Carolina 4-H@Home, Family #3’s mom signed up to begin receiving the daily emails. Family #3’s mom said that her sorority sister was a part of 4-H growing up, so she had heard of 4-H before. She also stated, “all of the advertising led me to contact our local county 4-H agent to get my son signed up.” Prior to COVID-19-related closures, Family #3 was not aware of local 4-H programming. Family #4 commented that their 4-H agent does a “good job” of communicating. Family #4’s youth were very active in county and statewide projects and held leadership positions locally. Family #4’s local 4-H agent was known for publicly advertising 4-H programming through various methods pre- and during-COVID-19. The facial expressions and non-verbal cues demonstrated in the Zoom recordings and documented in the interviewer notes furthered the emotions documented in the comments above. For example, Family #2 was obviously frustrated by the lack of communication, you could clearly see they had higher expectations from previous experiences with 4-H and really wanted the experience to continue to be a positive one for their family and others they recruited.

Category 2: 4-H Agent/Volunteer Leader Impact

The second category from the focus group was 4-H agent/volunteer leader impact. All four families had something to say regarding the leadership within the county where they participated. 4-H agent/volunteer leader impact can further be divided into positive and negative impact themes. Family #1 described the positive impact of their local 4-H agent: “our local agent is so gifted in matching the child with what will both be interesting to them and what will grow them and push them just a little bit at just the right time.” Family #1’s mom went on to compliment the other local agents the family works with, as well as the state staff. Family #2’s parents described the negative impact of their local 4-H agent/volunteer leader regarding an issue with the local organization before COVID-19 closures, but it seemed to be “explained away enough” and that they would let it slide after eventual communication. Family #2’s parents also mentioned that they were not “on the same standing as others” because they were not originally from their county, like their local leadership. Family #2 described their local 4-H agent as normally being a good agent, but “they [agent] just did not really step up during the pandemic.”

The disappointment and frustrations continued to build from Family #2, but the other families did not let the negative perceptions of one’s experience impact their overall perception of the impact of their 4-H agent/volunteer leader. Family #3’s mom said due to their participation in 4-H@Home, they were able to connect with their local agent. She said it was the best thing they could have done because the local agent is “wonderful.” Family #3’s local agent was complimented on their skills to work with younger children and that they are so welcoming. Family #3’s mom stated “[our agent] always provides a plethora of information for any activity and it helps so much since we are a brand new 4-H family.” Family #4’s 4-H member conveyed they like working with their local agent and that they do a “good job.” Family #4’s 4-H member also does a lot of projects that aligned with the expertise of the local 4-H agents and the excitement of the common interest was obvious in the videos and noted in the interviewer notes.

Conclusions, Implications, and Recommendations

Based on the focus group participants’ interviews, their 4-H agents should be commended for the programming made available during the Covid-19 pandemic, underscoring the fact that Extension professionals and volunteers were able to successfully pivot 4-H programming from predominately in-person to predominately virtual (Arnold & Rennekamp, 2020). “Virtual Programming did not eliminate the need for a local connection – it only highlighted the importance of a local connection who was a broker of education among: (a) networked programs, (b) local audiences, and (c) the land-grant institution” (J. L. Donaldson, personal communication, July 6, 2021).

McClelland’s (1987) need for achievement theory was useful for understanding 4-H retention among participating families. This theory warrants additional research, as we do not know the extent to which the needs of youth and families may have changed due to the pandemic and the associated fear and loss. The pandemic created substantial trauma, isolation, and loss of relationships (Arnold & Rennekamp, 2020). 4-H youth development programs may need to respond with discrete programs to promote mental and emotional health.

Family #1’s virtual experience and the local 4-H agent’s efforts met all three of McClelland’s (1987) needs: (1) achievement, (2) affiliation, and (3) power. Family #1’s mom reflected on how her older children became stronger leaders in 4-H through the local ambassador program and helped their younger siblings participate through 4-H kits. She [mom] said, “I really appreciated the Journey to Mars kit because my [age] year old was able to use it as a leadership opportunity on her resume for our local STEAM club.” Unfortunately, due to Family #2’s experience, none of McClelland’s Needs were met. The family recalled no communication from the local agent or volunteer, which was especially troubling to them since their two children were local club officers. Family #3’s experience allowed for two of McClelland’s (1987) needs to be met: achievement and affiliation. Because the 4-H member interviewed was very young and brand new to the program, they did not serve in any leadership roles. Family #3’s agent made opportunities available for youth to experience all of McClelland’s (1987) needs, despite this participating member’s young age. Family #4’s positive experience allowed for all three of McClelland’s needs to be met. Also, because of the opportunities Family #4’s local agent provided; McClelland’s (1987) needs were easily met.

Regarding communications, families appreciated the more frequent and detailed communication from county programs, as well as the improved marketing efforts. Despite this success, some areas for improvement were noteworthy. One family recalled not knowing if 4-H still existed in their county or in South Carolina due to the lack of communication. Communication is one of the most important skills within Cooperative Extension, especially 4-H. Ultimately, this related to the need for affiliation and the need for achievement (Gill et al., 2010; McClelland, 1987) for success, as it is essential for 4-H youth to feel connected to the youth organization (i.e., 4-H), the organization leader, and their friends, while perceiving the availability of engagement opportunities. Unfortunately, a lack of communication and limited opportunities (with the agent and programming) to engage hindered some families’ perceptions related to their members’ ability to be affiliated and obtain a sense of achievement.

Another category from this study was 4-H agent and volunteer impact. Families interviewed were asked about their relationship with the local 4-H agent or volunteer they worked with the most. Families #1, #3 and #4 described a positive relationship and praised their agent. Family #2 stated they have been working with a local volunteer and their 4-H agent and ever since COVID-19 pandemic closures, the impacts have been negative. From this focus group, it was clear that 4-H agents and volunteers can make or break the decision to join or re-enroll in a county program. If the need for affiliation is not met (McClelland, 1987), the retention of 4-H can be negatively impacted, ultimately affecting program quality (Gill et al., 2010). This became evident with the focus group interviews as families were either planning to remain or leave 4-H based on their perception of impact of the agent/volunteer leader.

While it is easy to implicate county 4-H agents for a lack of communications and a lack of programming during COVID-19-related closures, it is imperative to understand the challenges faced by Extension 4-H professionals and volunteers. Israel et al. (2020) described how COVID-19 affected Extension agents with having to manage work-life balance with multiple interruptions that could have affected programming efforts and communication with clientele. Extension agents and volunteers could have been dealing with the virus themselves or caring for an infected family member; caring for an elderly parent, family member, or neighbor; and/or may have needed resources to conduct regular work while quarantined at home. The pandemic took a toll on people in many different ways, but perhaps this was exacerbated with Extension Professionals in South Carolina as they were trying to learn a new platform (i.e., Zoom, Microsoft Teams, Google Meets) that they were not entirely comfortable with while simultaneously engaging with their clientele (Eck et al., 2022).

It should be noted that this study was limited to four families who participated in virtual programing during the pandemic is South Carolina and agreed to attend the focus group interviews for this study. Extension programming, especially youth programming, varied state by state and educator by educator, therefore the findings of this study were restricted to the views of the participating families’ experiences. Although limitations existed within the study, the findings, conclusions, and recommendations provided an opportunity for transferable results and best practices for those with similar needs and/or responsibilities within Extension programming. It was the responsibility of the research team to carry out the study based on the intended purpose, but it is up to the reader and potential applier of the results to make a judgement on the transferability of the study (Lincoln & Guba, 1985).  

State 4-H leaders are not only recommended, but highly encouraged, to create a best practices list for virtual 4-H programming. Designed by the researchers’ reactions to the data and their personal experiences, Table 1 outlines best practices to guide agents and volunteers in communicating with their clientele. Several of the best practices listed in Table 1 revolve around technology and Internet deficits experienced by many youth and their families (Evans et al., 2021). Gordon and Curlee (2011) remind us that good communication is essential in organizations and it is not productive for people to become quiet. They also state, “often, people ignore issues they shouldn’t” (Gordon and Curlee, 2011, p. 137) which can cause a snowball effect of issues building and success within the organization jeopardized. “Organizations can no longer rely on one-way communication methods to interact with stakeholders” (Holthausen et al., 2021, para. 31). Therefore, 4-H programs should be advertised via multiple methods such as online, hardcopy, television, or radio media. A list of best practices may be especially valuable for newly hired 4-H professionals who may or may not have the opportunity to be part of on-boarding procedures.

Table 1

Best Practices for 4-H agents, educators, specialists, and volunteers in Virtual Programming

Best Practice
Establish multiple methods of communication with county participants.
Create a contact list of people on the local, regional, and state level who can provide more information on virtual programming.
Advertise programs via online, hardcopy (mail/newspapers), television, or radio media.
Establish if 4-H participants will need to print materials used in virtual program.
Complete midway and end of the activity/program check-ins with the participants.
Offer to schedule (in-person or at-a-distance/Zoom) visits with participants to stay updated on them throughout the program year.

Future research should be explored using more families for interviews to gain a better understanding of 4-H leader impact. It is also recommended that in-person focus groups are held, with the option of virtual meetings via video conference. Based on the interviews conducted, it was evident the parents dominated the conversations as if the parents were vicariously giving accounts for the children. Based on this knowledge, it is recommended that the interviews be split into a conversation with parents only, and a separate conversation with just youth. Additionally, the questions and topics discussed within future research should be expanded to include use of the life skills learned in 4-H among 4-H members.

Overall, three of the four families interviewed for this study were pleased with their 4-H agent and volunteer’s impact and levels of communication during and post-COVID-19. There is room for improvement in both categories. 4-H agents and volunteers should continuously work on ways to improve their communication and teaching styles. These same caring adult leaders should not only think of youth, but also themselves when striving to “make the best better.”

References

Arnold, M. E., & Rennekamp, R. A. (2020). A time like no other: 4-H youth development and COVID-19. Journal of Extension, 58(3). https://joe.org/joe/2020june/comm1.php

Baney, C. N. M., Jones, K. R. (2013). Whatever it takes: A comparison of youth enrollment trends in 4-H livestock and non-livestock programs. Journal of Extension, 51(3). https://archives.joe.org/joe/2013june/rb2.php

Burnett, M. F., Johnson, E. C., & Hebert, L. (2000). The educational value of 4-H activities as perceived by Louisiana 4-H agents. Journal of Agricultural Education, 41(1), 49– 59. https://doi.org/10.5032/jae.2000.01049

Calvert, M., & Fabregas Janeiro, M. G. (2020). Impact of COVID-19 on Missouri 4-H state fair participation and implications for youth development programs. Journal of Extension, 58(6). https://www.joe.org/joe/2020december/comm1.php

Cooper, A. W., & Graham, D. L. (2001). Competencies needed to be successful county agents and county supervisors. Journal of Extension, 39(1). https://archives.joe.org/joe/2001february/rb3.php

Creswell, J. W., & Poth, C. N. (2018). Qualitative inquiry & research design: Choosing among five approaches (4th ed.). Sage.

Eck, C. J., Layfield, K. D., DiBenedetto, C. A., Jordan, J. K., Scott, S. O., Thomas, W., Parisi, M., & Dobbins, T. (2022). Assessing awareness and competence of best practices in synchronous online instruction during the COVID-19 pandemic for Clemson Cooperative Extension Professionals. The Journal of Extension, 60(1). https://doi.org/10.34068/joe.60.01.09

Evans, C., Moore, R., Seitz, S., Jatta, I., Kuperminc, G. P., & Henrich, C. C. (2021). Youth perspectives on virtual after-school programming during the COVID-19 pandemic. Journal of Youth Development, 16(5), 251-268. https://doi.org/10.5195/jyd.2021.1063

Gill, B. E., Ewing, J. C., & Bruce, J. A. (2010). Factors affecting teen involvement in Pennsylvania 4-H programming. Journal of Extension, 48(2). https://archives.joe.org/joe/2010april/a7.php

Glasser, B. G., & Strauss, A. L. (1967). The discovery of grounded theory: Strategies for qualitative research. Aldine.

Glesne, C. (2016). Becoming qualitative researchers: An introduction (5th ed.). Pearson.

Gordon, R. L., & Curlee, W. (2011). The virtual project management office: Best practices, proven methods. Management Concepts.

Gould, F. I., Steele, D., & Woodrum, W. J. (2014). Cooperative extension: A century of innovation. Journal of Extension, 52(1). https://www.joe.org/joe/2014february/comm1.php

Grégoire, H. (2004). Gathering wisdom from 4-H youth development clubs. Journal of Extension, 42(3). https://www.joe.org/joe/2004june/a5.php

Holtzhausen, D. R., Fullerton, J. A., Lewis, B. K., & Shipka, D. (2021). Principles of strategic communication. Routledge.

Hood, E. L. B. (2021). Were the “best made better” without in-person programming? Content analysis of extension 4-H programming during the COVID-19 pandemic in South Carolina (Publication No. 28650263) [Master’s thesis, Clemson University]. ProQuest Dissertations and Theses at Clemson University. https://tigerprints.clemson.edu/all_theses/3613

Lincoln, Y. S., & Guba, E. G. (1985). Naturalistic inquiry. SAGE.

Loose, C. C., Ryan, M. G. (2020, November 11). Cultivating teachers when the school doors are shut: Two teacher-educators reflect on supervision, instruction, change and opportunity during the Covid-19 pandemic. Frontiers in Education, 5(582561). https://doi.org/10.3389/feduc.2020.582561

McClelland, D. C. (1987). Human motivation. Cambridge.

McNeill, B. (2010). The important role non-parental adults have with youth learning leadership. Journal of Extension, 48(5).https://www.joe.org/joe/2010october/tt4.php

Monks, C. D., Hagan, A., Conner, K. (2017). Emphasizing extension’s unbiased, research-based recommendations is critical. Journal of Extension, 55(5). https://archives.joe.org/joe/2017october/comm1.php

Pardee, R. L. (1990). Motivation theories of Maslow, Herzberg, McGregor & McClelland. A literature review of selected theories dealing with job satisfaction and motivation. https://eric.ed.gov/?id=ed316767

Price, P. C., & Jhangiani, R. S. (2018). Research methods in psychology. Open Textbook Library.

Privitera, G. J. (2017). Research methods for the behavioral sciences (2nd ed.).SAGE.

Salkind, N. J. (2012). Exploring research (8th ed.). Prentice Hall.

Perceived Readiness of First Year Agriculture Teachers to Teach Low Socioeconomic Students

Rachelle Staehr, York High School, rachelle.staehr@yorkdukes.org

Nathan Conner, University of Nebraska-Lincoln, nconner2@unl.edu

Bryan Reiling, University of Nebraska-Lincoln, breiling2@unl.edu

Taylor Ruth, University of Tennessee, truth3@utk.edu

Jacob Goldfuss, Summerland Public School, jacobgoldfuss@summerlandbobcats.org

PDF Available

Abstract

Approximately10.5% of children in Nebraska live in poverty. Poverty in a child’s life impacts both physical and cognitive development. This qualitative case study explored agricultural education teachers perceived confidence when teaching students who come from low socioeconomic backgrounds. Eight high school agriculture teachers were interviewed, and the following themes emerged from the data: (a) teacher emotions, (b) observations, and (c) accommodations. The teachers felt prepared to teach students that are impacted by poverty. It is recommended that teacher preparation programs select courses that specifically address working with students that are living in poverty. Additionally, exposure to students from low SES backgrounds early in their teacher preparation program will help them to learn how to build positive relationships with students and how to accommodate this population.

Introduction

Children were the highest likely group of individuals to be living in poverty (Dornan, 2017). Talk Poverty (2020) identified that 10.5% of children in Nebraska public schools live in poverty. This correlates directly with Dornan’s (2017) identification of children being the highest likely group to live in poverty, as Talk Poverty (2021) ranked children at a higher rate of poverty than any other surveyed group. This growing issue was evident within Nebraska public schools and educators need to be prepared for it.

Throughout preservice teachers’ educational experiences, professors have utilized a variety of different methods to educate their students on this phenomenon. Cho et al. (2015) explored the option of educating teachers to be anthropologists in future encounters of student poverty, while Baggerly (2006) focused on the power of service-learning experiences. With a growing need for teacher confidence in the identification and accommodation of students of low socioeconomic status (SES), teacher educators must ensure they have prepared their students to effectively accommodate classroom instruction for students living in poverty.

Child poverty has reared its head as multidimensional poverty within American schools as students lack basic resources due to availability, location, and family structures (Dornan, 2017). Roelen (2017) discussed differences between children of monetary poverty and children of multidimensional poverty. Monetary poverty is described as strictly a measurement of household income and expenses and was also defined as indirect poverty because it is did not directly impact the resources of a family (Roelen, 2017). Roelen (2017) explained this concept by pointing out that not all financial funds accumulated by the household were used properly for the basic needs of all individuals within the household. Improper use of funds or lack of availability of basic needs within a community can create multidimensional poverty (Roelen, 2017). Multidimensional poverty was defined as the lack of and depletion of basic needs and resources (Roelen, 2017). This term was also referred to as direct poverty (Roelen, 2017). Each type of poverty is unique but not necessarily linked to each other depending on the economic status of the country inhabited (Roelen, 2017). 

Gupta (2017) gave readers a glimpse of a family’s life within poverty by providing a view of the assumptions and realities of their lives. America’s social work system has been known to sometimes forget to account for poverty when visiting families (Gupta, 2017). Gupta (2017) illustrated a situation in which individuals living in poverty were surrounded with assumptions of drug use and had parenting rights removed with little to no evidence. Thiede and Brooks (2018) outlined the correlation between immigration, family history, and poverty. This quantitative analysis identified that individuals of first and second generations who had two foreign born parents had a higher likelihood than other foreign individuals of living in poverty in America (Thiede & Brooks, 2018). This unfortunate relationship has been reality for many children in public schools and should be recognized by American school systems.

The direct relationship of poverty and its impacts on a child’s cognitive development was illustrated by Dolean et al., (2019) in a study done on the relation of socioeconomic status (SES) and development of reading and linguistic skills. SES was the likely root cause for many children’s inability to academically excel in the classroom (Dolean et al., 2019). Research identified frequent school absences, phonetic awareness, and bilingual homes to be largely impactful on the slow development of basic academic skills (Dolean et al., 2019). SES was directly linked to poor linguistic, phonetics, reading, letter knowledge, and nonverbal IQ (Dolean et al., 2019). Li et al. (2020) hypothesized that poverty and mental health have been negatively correlated. Li et al. (2020) survey asked school aged children about their access to common educational resources relative to their current mental health state. Anxiety and depression were common themes that manifested among students with lower SES, and poverty levels were associated with increased mental health issues in children (Li et al., 2020).

Over the past few years, school systems have subscribed to the ideas of Ruby Payne and her framework for understanding poverty (Osei-Kofi, 2005). These ideas were presented to communicate social norms and commonalities amongst those living in poverty (Osei-Kofi, 2005). Although these theories outlined positive things teachers can do for students, Osei-Kofi’s (2005) review identified its flaws of the framework in today’s world. Being a teacher himself, Osei-Kofi had a direct point of view on the impacts of Payne’s framework on his own school. He observed that the framework created biases around certain groups of people and the framework’s influence on the No Child Left Behind Act gave teachers almost impossible standards to reach (Osei-Kofi, 2005). The No Child Left Behind Act created a system in which standardized tests blamed teachers for any student failure (Osei-Kofi, 2005). Although much of Payne’s research was valid, she made assumptions that stretch teacher’s limits and impose unfair assumptions on students (Osei-Kofi, 2005). One example from Osei-Kofi’s (2005) review indicated  that Payne outlined children in poverty as inadequate and in need of repair from a teacher. The responsibility of the student’s so-called repair was placed solely on the teacher (Osei-Kofi, 2005).

An article by Payne and Ortiz (2007) outlined multiple factors such as socioeconomic status of a household and the talent of teachers as huge impacts on the success of students in the classroom. Many of those students who have struggled with standardized tests may also be victims of multidimensional poverty (Payne & Ortiz, 2007). Educators cannot solve child poverty; they do not have the responsibility of child poverty, but they have been  doing everything they can to help children living in poverty (Payne & Ortiz, 2007).

The exploration of child poverty, cognitive development, and educator limits lead us toward identification of applicable solutions for how America’s educational system can help children in poverty. Jackson (2014) explored the emotions of educators and students surrounding children living in poverty and found that there was a shocking overall acceptance of poverty by our society. Educators have a duty to promote proper emotional response to social injustices (Jackson, 2014). There was no shortage of sympathy amongst students and teachers, but empathy will be  needed to impact society (Jackson, 2014). Empathy is the initial step in the emotional process and is needed to enact change within society (Jackson, 2014).

Sato and Lensmire (2009) pointed out that teachers should be culturally responsive. While teachers may already do this, it needs to be an intentional effort to really assist students in poverty. For example, teachers need to recognize that not all students, based on factors such as SES, have the same prior knowledge or commonalities that were often assumed within the classroom (Sato & Lensmire, 2009). Students of poverty may not have these shared experiences (Sato & Lensmire, 2009). An empathetic and involving teacher is one who is also culturally aware throughout their curriculum (Sato & Lensmire, 2009).

The Poverty Simulation was a program utilized in the education of college students entering social work and health care fields (Vandsburger et al., 2010). This case study utilized three common scales used in diversity education: (1) the Critical Thinking Scale, (2) Understanding of Others Scale, and the (3) Active Learning Scale are used to measure the effectiveness of this simulation (Vandsburger et al., 2010). The simulation consisted of daily tasks and navigation through life for a given amount of time as an individual of poverty (Vandsburger et al., 2010). While 82.2% of individuals who participated in this simulation experienced further contemplation of poverty’s effects, only 58.4% of participants were moved to take social action (Vandsburger et al., 2010). Results of this study showed that the simulation was impactful in the education of college individuals, but true empathy was not always reached (Vandsburger et al., 2010).

Community connections and service learning are powerful educational tools that were explored by Baggerly (2006) in the setting of the education of preservice teachers. Service learning was outlined as a symbiotic relationship between urban communities and universities within them (Baggerly, 2006). A lot of students attending universities have minimal experience with poverty themselves, so properly designed service-learning projects can provide them exposure to the impacts of poverty (Baggerly, 2006). This experience was valuable for preservice teachers because it helped them understand the background of future students in poverty (Baggerly, 2006). Major goals of service learning should be for students to experience different cultures and to encourage students to take social action (Baggerly, 2006). These impactful projects can create knowledge that preservice teachers can draw from in their teaching careers (Baggerly, 2006). This experience was recognized as impactful in educating students about the realities of poverty (Baggerly, 2006).

Purpose

The purpose of this case study was to explore the perceived preparedness of first year agricultural teachers from the University of Nebraska to educate an increasing population of children of low socioeconomic status (SES) in Nebraska public schools. The preparedness of first year agriculture  teachers to educate students of poverty was defined as their feelings toward the accommodations they are able to make. The overarching research question was, do first year agricultural teachers who graduated from University of Nebraska feel prepared to educate students who are impacted by childhood poverty?

Methods

Qualitative research was conducted because it allows researchers to create a vivid interpretation of the world around them (Creswell & Poth, 2018). This qualitative study was working on the assumption that there was a growing need for first year agricultural teachers to be holistically educated on child poverty to increase their confidence in the identification and accommodation techniques for these students. A case study methodology was used in this study. As defined by Creswell and Poth (2018), a case study is the study of an actual, real life, case within a real context. A case study also takes place within a system that is bounded by a place and time (Crestwell & Poth, 2018). The bounded system recognized in this study, and hence the participation criteria for this study, was first year agricultural teachers from University of Nebraska who were employed by Nebraska public schools.

This study utilized purposeful sampling to select the individuals who provided experiences and information that were consistent to this bounded system. An initial recruitment email was sent to 28 agricultural teachers who met the participation criteria. There were only eight first year agriculture teachers from University of Nebraska that agreed to participate in the study. Creswell and Poth (2018) posited that five participants are adequate for a case study, however, we used eight participants to help achieve data saturation.

Participant/School Description

Teacher one came from a school in northeastern Nebraska and was the only agricultural teacher at this school. Student diversity included about a 69% population of white individuals and around a 22% population of American Indian individuals (Nebraska Department of Education, 2021). Teacher two was one of two agricultural teachers at a large high school in eastern Nebraska. This diverse school had a population of about 68% Hispanic students with 13% white as the next highest race within the population (Nebraska Department of Education, 2021). Teacher three came from a one teacher agricultural education program at a school in southeastern Nebraska with a high majority white student population (Nebraska Department of Education, 2021). The fourth, fifth and sixth teachers interviewed were also in one teacher programs at schools in the central (T4), northern (T5), and southern (T6) parts of Nebraska with high majority white student populations (Nebraska Department of Education, 2021). The seventh and eighth teachers came from small, one teacher program schools, while being located in western (T7) and central (T8) Nebraska schools. Both T7 and T8 were located at schools with a high majority white student population as well (Nebraska Department of Education, 2021).

Data Collection and Analysis

This qualitative case study used semi-structured interviews to collect data during September 2021. The semi-structured interviews took place over Zoom and lasted approximately 20 minutes. The interview questions allowed for open-ended answers that encouraged storytelling and real-life examples. The interviews were recorded and transcribed through Zoom. Data was analyzed for the emergence of themes. The transcripts were read three times and reoccurring words, phrases, and ideas were categorized together and used to identify the themes that emerged. Creswell and Poth (2018) stated, “themes are broad units of information that consist of several codes aggregated to form a common idea.” (p. 186). Codes were organized into themes using tables to help conceptualize the overarching concepts.

Trustworthiness

Trustworthiness measures were used to determine the truth, value, credibility, and reliability of the research study (Dooley, 2007; Erlandson, et al., 1993; Lincoln & Guba, 1985). Triangulation was achieved in this study by use of multiple researchers (Dooley, 2007; Lincoln & Guba, 1985). Peer debriefing was used and allowed a researcher that was not associated with the study to review the data and give insight on how the data was analyzed(Lincoln & Guba, 1985; Dooley, 2007).

Subjectivity Statement

As an agricultural education teacher at a public school and the lead researcher on this article, I have encountered a higher rate of students living in poverty or of low SES than I expected. This study was completed during my third-year teaching and I found myself still having to adapt to many new and shocking situations. For example, many of my students lack funds available to supply their own jeans and boots for welding classes and other students have told me about nights they spend in their cars. The reason why I wanted to select my sample specifically from agricultural teachers because in my personal experience, many disadvantaged students are ‘dumped’ in agricultural courses to explore careers. Even though school counselors have good intentions, students in poverty can easily fall behind in these hands-on classes. These students may have a difficult time purchasing or providing the extra supplies that are typically needed. As a teacher, I would like to be better prepared to help these students and to identify tools to help support them as an empathetic, positive role model in their lives.

Findings

The following themes emerged from the data: (a) teacher emotions, (b) observations of poverty, and (c) accommodations. Within these themes, various codes were identified to help sort and categorize data and commonalities throughout the interviews.

Theme #1: Teacher Emotions

The theme of teacher emotions was defined by the internal feelings’ teachers have as they navigate difficult decisions when working to accommodate students of poverty. During interviews, many emotions were discussed. Teachers identified common emotions of empathy, concern, and compassion. Empathy was expressed by T1, T2, T4, T5, and T8 when acknowledging that many students were in poverty situations through no fault of their own. T1 indicated that students were usually helpless in their own availability of resources. T2 explained that many students living in poverty missed out on opportunities teachers try to provide, this leaves teachers feeling heartbroken. T2 continued to explain their feelings on this issue by saying, “I know they’re going to have these struggles in life because they are already behind the eight-ball compared to many other peers, and for no reason than being born into the circumstances.” T2 and T4 also expressed an interest in breaking the cycle of poverty experienced by many of their students.

When the concerns of participants were addressed, the collective consensus of T1, T3, T6, and T7 was that all teachers feel the stress and difficulty of helping these students. T3 illustrated their own worry over the physical conditions these students live in each day and how the physical conditions impacted their abilities within the classroom. T3 and T7 both expressed a feeling of helplessness in many of the situations they encountered. Emotions of grace and compassion were also identified with T2 and T8. Prioritizing what was best for students and having a forgiving attitude was emphasized by T2. T8 described a deep respect for students who juggled the complications of a life in poverty yet maintain a positive influence within school.

Theme #2: Observations of Poverty

Observations of poverty was defined by the identifying factors of poverty teachers have witnessed within their first couple of months teaching. These observations were broken down into the following sub themes: physical observations, impacts of poverty, and lack of resources.

Physical Observations

Location of observations made by educators who participated in these interviews ranged from the general community to inside the school building. T1 reported their own physical observations of poverty by simply driving around town and seeing where students were living. Behaviors observed inside the schools by T1, T2, T5, T6, T7, and T8 included students missing school due to babysitting responsibilities, wearing old clothes every day, lack of hygiene, taking home school lunch to share with family, difficulties focusing, and a lack of engagement whenever money was mentioned in class. T6 stated, “As I discussed details for a fieldtrip, I watched a student physically slump in their chair when I requested students bring money for lunches.”

Impacts of Poverty

Many teacher observations were made individually through strong personal relationships built with students in poverty. Through relationships, students can reveal details about their lives that identify themselves as children of poverty. These conversations created observable information for teachers. T4 and T5 discussed being shocked at the sheer lack of confidence many students express during conversations with students of poverty. T2 described one situation by saying, “I’ve got one student, I know, that works until 11 o’clock every night to help her family pay the bills, so they have a lot of missing assignments.” T3 and T7 also could identify students in similar situations. T2’s students also expressed interests in being the first generation in their families to attend college or trade school. T1 theorized that many students living in poverty were highly motivated by simply wanting to break their own cycle. T4 expressed their observations of high levels of hard work and determination from students living in poverty. T3, T4, and T8 identified lack of sleep and emotional stress as two consequences of poverty. T3, T4, and T8 reported students helplessly falling asleep in class after working a long night shift. T3 also reported having students act distant and emotional due to the stresses of their everyday life. These two impacts had a severe negative toll on the student’s abilities to learn and participate in class. Through personal conversations with students T3 and T8 concluded students who were consistently overly tired in class usually spent time working to pay bills. Students could easily be overscheduled, and some employers may not recognize the demands on their time. T3 said, “Our school actually reached out and said, hey, just be aware that these are high school students and we know that they’re working a lot. First and foremost, they need to be students.” T3 and T4 pointed out that poverty may not allow children to experience as many opportunities.

Lack of Resources

All teachers interviewed identified examples of actual lack of resources from students in poverty. During the shutdown of many schools, due to the COVID-19 pandemic, students were expected to learn from home using technology and the internet. However, T1, T2, and T4 identified the lack of reliable internet and technology was problematic for many students in poverty. T4 indicated that students living in poverty had issues sourcing these necessary resources and sharing them with siblings in the same situations. This lack of resources could include a lack of equipment within a household, lack of bandwidth, or lack of reliable internet. All teachers interviewed also indicated that transportation and financial support impact students’ school experiences. Although public education is free, extracurricular activities that compliment classroom learning are not. T2, T4 and T8 explained different situations in which students could not afford opportunities that FFA provides. However, these teachers made their own accommodations for these students.

Theme #3: Accommodations

The theme of teacher accommodations was defined as any adaptations or changes teachers made to help students of poverty. The different accommodations teachers made all fell into the following sub themes: (a) advocacy, (b) relationships, and (c) monetary support.

Advocacy

Some great points brought up through discussion with T3 included strong intentions to advocate for students. T3 stated: “I will do whatever I can to make sure that you’re (students are) supplemented with whatever you (students) need.” T1 stated that agricultural educators, have a unique advantage compared to other teachers because of their preparation to mentor a student to explore certain careers and trades. Agricultural educators teach classes directly tied to real life careers. Students who have taken agricultural classes were taught basic skills needed for entry level positions out of high school within agricultural careers or the trades. T1 also expressed focusing class content on trades that all students could explore. All teachers interviewed believed it was their job to advocate for their own students.

Relationships

Relationships, built through classroom experiences, were a huge asset when working with students. Through strong student relationships, T1, T2, T3, T4 and T6 provided examples of simple accommodations provided. Based on student suggestions, accommodations made by T1, T2, and T6 included virtualizing assignments for accessibility, providing class work time, and allowing retakes. These simple steps provided a more stress-free environment for students. T3, T4, T7, and T8 also accommodated students by providing all materials needed for class and creating an open line of communication where teachers can easily check in on students.

Monetary Support

T1 and T4 mentioned that FFA provided help to support students who cannot afford opportunities that exist within the organization. T5, T6, and T7 also discussed how they discretely provided extra cash to students who cannot afford lunches on trips and hold fundraisers for all students to provide free opportunities within FFA. These young teachers were already expressing the importance of finding a way to include all students in all activities to create a strong organization and environment.

Conclusions, Discussion, and Recommendations

Educators of today are almost certain to encounter a significant percentage of students living in poverty. America’s public school system has not clearly set the expectations of educator’s role in these student’s lives. Child poverty is a phenomenon that increasingly plagues our world and is currently being addressed through policy changes. These policy changes in our nation as well as others have the intent of bringing children out of poverty through economic focuses (Dornan, 2017). Nations are working to assist the growing population of children in poverty.

Teachers interviewed in this study were able to convey how they have felt while accommodating students of poverty. Emotional stress of teachers is a real issue and relating it to their education of students of poverty may be an indicator of their preparation to deal with this issue. Feelings of helplessness was a key concept identified through these interviews that could indicate deficiency in the preservice teacher’s education. When looking at the emotions reported by teachers interviewed, concern was likely stemming from the level of care they have for students. Most teachers interviewed appeared to genuinely care about their student’s wellbeing and little to no emphasis was placed on the teachers’ own feelings about their own abilities. Empathy was a concept utilized by all teachers interviewed. As Jackson (2009) mentioned, empathy is critically important in creating a learning environment that accompanies all students. The fact that all teachers interviewed were aware of and practicing empathy was a clear indication that they know what they need to do to help their students in poverty. However, teachers need to be taught how to take care of their own mental health needs. Agricultural teacher preparation programs should incorporate stress management techniques into their programing and develop units or workshops on how to take care of your mental health. A focus on taking of your mental health should be embedded into the entire agricultural teacher education program. Preservice agriculture teachers need to see positive examples of self-care and they also need structured opportunities throughout their program to practice self-care.

Although these young teachers were only a couple of months into their teaching career, they have been able to report a wide array of observations that can be used to identify students in poverty. Signs of poor health, both mental and physical, were used as identified by the teachers, which aligns with Li et al. (2020) assertion that students living in poverty struggle with maintaining their mental and physical health. All teachers interviewed had some sort of observation or story to report in which they identified poverty. These young teachers were able to see poverty in front of them; therefore, something in their education has prepared them for this issue. All of the teachers that participated in this study completed a 20-hour service learning project that required them to work with after school programs in a city. The service learning projects during their agricultural teacher education preparation program exposed the teachers to students of various social economic statuses. The incorporation of a service-learning project at after school programs is recommend for agricultural education teacher preparation programs to help expose the future teachers to a diverse group of students.

The accommodations explained by the teachers interviewed were both effective and creative in their nature. Financial, emotional, and health focused support was given by all teachers interviewed through simple accommodations they made in their classrooms and organizations. Teachers interviewed explained how they listen to student’s needs and communicate with them to create great relationships and effectively help students. This use of relationships to benefit students was a major sign of competency amongst these teachers. Similarly, this could be attributed to the service learning project that exposed the preservice agriculture teachers to students from diverse backgrounds.

Many children living in poverty not only lack financial resources, but also emotional resources, role models, and a general support system (Cuthrell et al., 2007). All of the teachers interviewed identified experiences they had in which positive relationships with students helped them provide individualized support to students in need. Positive relationships not only help students emotionally but will likely lead to higher academic achievement. It is recommended that agriculture teacher preparation programs emphasize the power of positive student teacher relationship and give the preservice teachers multiple opportunities to work with high school students so they can practice building relationships.

The young teachers interviewed demonstrated that they felt adequately prepared to deal with the realities of educating students of poverty. Although some indications of helplessness were communicated through interviews and many creative and adapting accommodations were discussed by each teacher. There were great solutions that already exist amongst this group of young agricultural teachers. Agricultural education is unique because it is so closely related to careers and hands-on opportunities. Because counselors push students of poverty towards career focused opportunities, many are enrolled in agricultural classes. These interviews revealed the young agricultural teachers were aware of this poverty issue, and they are up to the challenge of bettering student lives. We recommend that teacher preparation programs select courses that specifically address working with students living in poverty. Additionally, exposure to students from low SES backgrounds early in their teacher preparation program will help them to learn how to build positive relationships with students and how to accommodate them. The development of a sustained mentorship relationship between a preservice agriculture teacher and a low socioeconomic high school student is recommended. This mentor/mentee relation should be sustained over a long period of time so that the high school student and the preservice agriculture teacher can both experience growth and development. Ideally, the mentor/mentee relationship would start when the preservice teacher is in the first year of their program and the high school student is a freshman. If possible, the mentor/mentee relationship could last between two to four years depending on the duration of the agricultural teacher preparation program.

Future research that should follow up this study to include identifying what specific education methods for poverty education are the most impactful. A phenomenological case study should be conducted to better understand the feelings, perspectives, and needs of low socio-economic agriculture students.  An analysis of current poverty educational methods used may give teacher educators a better idea on how to create the most impactful experience for their students.

References

Baggerly, J. (2006). Service learning with children affected by poverty: Facilitating multicultural competence in counseling education students. Journal of Multicultural Counseling and Development, 34(4), 244–255. https://doi.org/10.1002/j.2161-1912.2006.tb00043.x

Cho, M., Convertino, C., & Khourey-Bowers, C. (2015). Helping preservice teachers (PSTs) understand the realities of poverty: Innovative curriculum modules. Educational Technology Research and Development, 63(2), 303–324. https://doi.org/10.1007/s11423-015-9366-9

Creswell, J. W., & Poth, C. N. (2018). Qualitative inquiry and research design: Choosing among five approaches. Sage.

Cuthrell, K., Ledford, C., & Stapleton, J. (2007). Empty tissue boxes considering poverty in diversity discourse. Childhood Education, 83(5), 273–276. https://doi.org/10.1080/00094056.2007.10522931

Cuthrell, K., Stapleton, J., & Ledford, C. (2009). Examining the culture of poverty: Promising practices. Preventing School Failure, 54(2), 104–110. https://doi.org/10.1080/10459880903217689

Dolean, D., Melby-Lervåg, M., Tincas, I., Damsa, C., & Lervåg, A. (2019). Achievement gap: Socioeconomic status affects reading development beyond language and cognition in children facing poverty. Learning and Instruction, 63(1), 1-10. https://doi.org/10.1016/j.learninstruc.2019.101218

Dooley, K. (2007). Viewing agricultural education research through a qualitative lens. Journal of Agricultural Education, 48(4), 32-42. https://doi.org/10.5032/jae.2007.04032

Dornan, P. (2017). Children, poverty and the sustainable development goals. Children & Society, 31(2), 157–165. https://doi.org/10.1111/chso.12209

Erlandson, D. A., Harris, E. L., Skipper, B. L., & Allen, S. D. (1993). Doing naturalistic inquiry: A guide to methods. Sage.

Gupta, A. (2017). Learning from others: An autoethnographic exploration of children and families social work, poverty and the capability approach. Qualitative Social Work QSW Research and Practice, 16(4), 449–464. https://doi.org/10.1177/1473325015620946

Jackson, L. (2014). “Won’t somebody think of the children?’ Emotions, child poverty, and post-humanitarian possibilities for social justice education. Educational Philosophy and Theory, 46(9), 1069–1081. https://doi.org/10.1080/00131857.2014.931430

Li, C., Yin, X., & Jiang, S. (2020). Effects of multidimensional child poverty on children’s mental health in Mainland China. Journal of Health Psychology, 25(3), 400–415. https://doi.org/10.1177/1359105317718379

Lincoln, Y. S. & Guba, E. G. (1985). Naturalistic inquiry. Sage.

Merriam, S. B., & Tisdell, E. J. (2016). Qualitative research: A guide to design and implementation (4th ed.). Jossey-Bass

Nebraska Department of Education. (2021). 2020/21 free and reduced lunch counts by school. Author. https://www.education.ne.gov/dataservices/data-reports/.

Nebraska Department of Education (2021). 2020/2021 membership information. Author. https://www.education.ne.gov/dataservices/data-reports/

Osei-Kofi, N. (2005). Pathologizing the poor: A framework for understanding Ruby Payne’s work [Review of the book A framework for understanding poverty by R. Payne]. Equity & Excellence in Education, 38(4), 367–375. https://doi.org/10.1080/10665680500299833

Payne, C., & Ortiz, C. (2017). Doing the impossible: The limits of schooling, the power of poverty. The Annals of the American Academy of Political and Social Science, 673(1), 32–59. https://doi.org/10.1177/0002716217719019

Roelen, K. (2017). Monetary and multidimensional child poverty: A contradiction in terms? Monetary and multidimensional child poverty. Development and Change, 48(3), 502–533. https://doi.org/10.1111/dech.12306

Sato, M., & Lensmire, T. (2009). Poverty and Payne: Supporting teachers to work with children of poverty. Phi Delta Kappan, 90(5), 365–370. https://doi.org/10.1177/003172170909000512

Talk Poverty. (2020). Nebraska 2020. Center for American Progress. https://talkpoverty.org/state-year-report/nebraska-2020-report/

Thiede, B., & Brooks, M. (2018). Child poverty across immigrant generations in the United States, 1993–2016: Evidence using the official and supplemental poverty measures. Demographic Research, 39, 1065–1080. https://doi.org/10.4054/DemRes.2018.39.40

Vandsburger, E., Duncan-Daston, R., Akerson, E., & Dillon, T. (2010). The effects of poverty simulation, an experiential learning modality, on students’ understanding of life in poverty. Journal of Teaching in Social Work, 30(3), 300–316. https://doi.org/10.1080/08841233.2010.497129

Agricultural Entrepreneur Involvement of Eight Botswana Women: A Qualitative Study

Carrie Stephens, Professor, The University of Tennessee, cfritz@utk.edu

Haley Kelso, Graduate Assistant, The University of Tennessee, hkelso@vols.utk.edu

Sharon Jean-Philippe, Professor, The University of Tennessee, jeanphil@utk.edu

Jennifer Richards, Associate Professor, The University of Tennessee, jennifer.richards@utk.edu

Natalie Bumgarner, Associate Professor, The University of Tennessee, nbumgarn@utk.edu

Liz Eckelkamp, Associate Professor, The University of Tennessee, eeckelka@utk.edu

Shelli Rampold, Assistant Professor, The University of Tennessee, srampold@utk.edu

Neal Eash, Professor, The University of Tennessee, neash@utk.edu

Brent Lamons, Assistant Professor of Practice, The University of Tennessee, blamons1@utk.edu

PDF Available

Abstract

The dynamics of agriculture in Botswana have been deeply rooted in traditional cultural values and have been shaped by the close connection between men and agriculture. Specifically, the dominance hierarchies that existed are those related to realities and relationships between those of humans and animals and their interconnectedness. The purpose of this study was to explore the leadership journeys of eight women in Botswana who have been involved in production agriculture. The central research questions asked were: (1) What lived experiences helped you obtain your agricultural position; and (2) What leadership characteristics do you identify as essential in your success? The participants for this study consisted of eight women in agriculture from Gaborone and Mabalane, Botswana. The methods employed to collect data in this study included three to four hour in-depth, audio-taped interviews. The researchers then discussed each individual’s coding schematic and emerged seven themes: (1) journey in agriculture; (2) networking and mentoring learning initiatives; (3) leadership and management; (4) family structure; (5) Botswana culture and agriculture; (6) awareness and shift of agriculture in Botswana; and (7) perspectives on values and motivations. Women who seek leadership opportunities, specifically those in the agricultural industry, would benefit from understanding how the participants of this study first became inspired and how they were encouraged to seek out advancement in their chosen career path. These shared experiences can communicate a framework for women who are inspired to lead in the agricultural industry – particularly in international settings.

Introduction

The past few decades saw the emergence of many female leaders in agricultural professions (Brawner et. al, 2020; Kleihauer et al, 2012; Stephens et al., 2018). These leaders have overcome numerous obstacles, yet their tenacity and persistence yielded success within their industry. However, the published literature was nearly devoid of case studies outlining the barriers that they overcame, and the leadership skills needed to obviate the roadblocks (Carroll et al., 2021; Cline et al, 2019; Frankel et al, 2023; Kleihaur et. al, 2013). Our heuristic approach evaluated successful Batswana female entrepreneurs through lengthy face-to-face interviews and observations in their workplaces. Documentation of their successes and leadership skillsets could provide groundwork for assisting females in leadership development in an emerging African nation.

In Botswana, the dominance hierarchies that existed were those related to realities and relationships between those of humans and animals. (Hovorka, 2012). Historically, Batswana women were perceived socially as housewives and expected to bear children, and those who could not bear children held a lesser societal status (Ntseane, 2004). This value system also existed in the agricultural sector. While women were historically seen as rural caretakers, Botswana men were offered the luxury of raising cattle — as more or less a sole occupation —because they were seen as suitable to raise the prominent commodity associated with wealth —cattle (Horvorka, 2012). Recently, new urban and commercial agriculture spaces have emerged, empowering women as poultry producers, albeit in varying ways and with varying outcomes, relative to their initial positionalities and relative to men and cattle respectively. Therefore, “gender and species status, roles, places and use values in Botswana are inherently dynamic and offer avenues for symbolic and material re-positioning” (Hovorka, 2012, p. 879).

The empowerment of women in Botswana has led to increased interest and presence of women in the agricultural labor force in Botswana, specifically in urban agriculture (Crush et al., 2011). From 1990 to 2019, the percentage of women involved in Botswana’s labor force increased from 49.8% to 68.5% (The World Bank, 2020). Despite these labor force changes, women in Botswana were considered poor, as a higher proportion of female-headed households were considered poor or very poor (Government of Botswana, 2020).

While the Botswana Government has expressed commitment to gender equality, they are still experiencing difficulty implementing appropriate initiatives (Botlhale, 2020). Further, institutional-level initiatives have been found insufficient in changing deeply rooted ideologies pertaining to the roles of women (Botlhale, 2020). As such, initiatives at the village level may hold promise for enhancing women’s empowerment in Botswana (Must & Horvorka, 2019). The results of this study can assist policy moves that can further raise status of women in Botswana.

Currently, the overall governmental economic initiatives in Botswana revolve around diamonds, but more efforts are being made to increase access to technical education and initiatives in tourism and agriculture (Reuters Staff, 2018). However, the overall decision-making in Botswana has been influenced by males, which has hindered the ability of women to advance or have significant influence on national decisions (Government of Botswana, 2020). Therefore, this study was undertaken to provide insight into a workforce that displays diversity, productivity, and quality by describing women’s experiences on each of their journeys, and how they are aspiring to reach their leadership goals within the agricultural industry in Botswana.

Theoretical Framework

Situational and authentic leadership theories guided this study. Situational leadership was derived from the idea by Hersey and Blanchard (1972). The model is constructed to focus on the maturity of the individual who is being supervised. Maturity is defined as “the capacity to set high but attainable goals, willingness and ability to take responsibility, and education and/or experience of an individual or a group” (p. 161). The model is divided into quadrants and represents an individual’s personality and how the individual progresses as he/she matures. The first quadrant, high task/low relationship, represents an individual that is more concerned with the tasks to be accomplished, and is not concerned with the personal feelings of their cohorts. An individual that is concerned with the task of a project but also takes into consideration the feelings of their cohorts represents the second quadrant, high task and relationship. An individual who is concerned with their cohort’s personal feelings rather than completing the task represents the third quadrant, low task and high relationship. An individual who is not concerned with the task of the project or the personal feelings of their cohorts represents the last quadrant, low task and relationship. Supervisors need to adjust their leadership style as the individual matures. In the context of this study, situational leadership is an applicable lens because every participant derived their leadership experience from a unique situation. Situational leadership theory can thus provide further insight into how participants’ unique backgrounds and positions explain their actions and interactions as leaders.

Authentic leaders are those “who are deeply aware of how they think and behave and are perceived by other as being aware of their own and others’ values/morals perspectives knowledge and strengths; aware of the context in which they operate; and who are confident, hopeful, optimistic, resilient, and of high moral character” (Avolio & Gardner, 2005, p. 321). The key components of an authentic leader are positive psychological capital, positive moral perspective, leader self-awareness, leader self-regulation, leadership process/behaviors (positive modeling, support self-determination, personal and social identification), follow self-awareness, follower self-regulation, follower development, organizational context, and performance (Avolio & Gardner, 2005). Researchers believed the women had evolved into authentic leaders through their life experiences; thus, the reason for utilizing the authentic leadership framework.

Purpose and Central Research Questions

The purpose of this study was to explore the leadership journeys of eight women in Botswana who are involved in production agriculture. The central research questions asked were: (1) What lived experiences helped you obtain your agricultural position; and (2) What leadership characteristics do you identify as essential in your success?

Methods and Procedures

To fully comprehend the experiences participants shared, the current study was performed using the qualitative mode of inquiry (Lincoln & Guba, 1985). The qualitative approach is justified in that it seeks to understand the phenomenon (Flick, 2014) of women’s experiences of their leadership journeys. A phenomenological approach was utilized to gain entry into the conceptual world of the women in order to understand how and what meaning they construct from their childhood, adulthood, personal, work, and leadership experiences (Lincoln & Guba, 1985). This approach is appropriate because the researchers explored a phenomenon and what the Botswana women experienced in agriculture.

The participants for this study consisted of eight women in agriculture from Gaborone and Mabalane, Botswana, two contrasting population settings. Mabalane is a small village (population~1,000); Gaborone is the capital city (population ~250,000). The reason only eight women were selected was due to researchers limited duration in country and we wanted ample face-to-face interaction with each participant. These women were individually identified from an international non-profit (Dream Academy) and consultation with the Botswana University of Agricultural and Natural Resources faculty who worked in community outreach. These women were considered leaders amongst their peers in their selected agriculture venue and had received recognition for their innovation in commercial agriculture sector. The women were middle-aged, urban and rural backgrounds, and they were all engaged in production agriculture. In an effort to protect the identity of the women, there will be limited background information given about the participants and participant numbers were assigned (Woman 1, 2, 3, 4, 5, 6, 7, and 8).

The methods employed to collect data in this study included: (a) interviews, (b) field observations, and (c) documents and pictures. Gathering information in this manner provided the researchers with a bank of data from which themes could be created, interpretations made, and a “rich, full picture of a research situation” painted (Wright 2003, p. 8). Interviews were three hour in-depth, audio-taped interviews, in which the primary researchers asked open-ended, non-leading questions (Lincoln & Guba, 1985). The central research questions focused on having each woman explain her journey (past and present) to her current leadership role. Based on each interview, follow-up questions were asked but based on the flow of the interview, some follow-up questions were unique to each individual. The interviews focused on revealing the influences and experiences that helped to develop each woman into the leader she is today. This open-ended approach enabled the researchers to gain an understanding related to each woman’s unique lived experiences (Lincoln & Guba, 1985). Observations were conducted before, during, and after the interview sessions by individuals involved with the research project and included taking detailed notes on body language, word descriptions and analysis, and behavior related to the interview and discussions opportunities (eating supper with participant, guided tours, etc.). Additionally, the researchers were participant observers for one to five days in each woman’s environment; the number of days spent with each participant was dependent upon that participant’s personal schedule. A participant observer interacts with the participants in the environment, so they can experience the environment like the participant (Lincoln & Guba, 1985). Lastly, documents (articles, accolades, etc.) that were collected by researchers were related to each woman’s lived experiences. These included pictures of the participants accomplishments, family photos, work experiences, and so forth.

Data were analyzed and coded by five researchers independently. The interview transcriptions were open-coded to discover the main concepts and categories (Lincoln & Guba, 1985). The researchers analyzed the in-depth interviews, along with the researchers’ field notes, which captured the thoughts related to the women agriculturists and their environment. These field notes were used in the data analyses to assist the researchers in recalling what had occurred during the field experience. Furthermore, data were examined using several methods including: identifying significant statements and elements of meaning; creating textural and structural descriptions; and recognizing descriptions which revealed commonalities among the participants’ experiences (Lincoln & Guba, 1985). The researchers then discussed each individual’s coding schematic and agreed upon seven themes: (1) journey in agriculture; (2) networking and mentoring learning initiatives; (3) leadership and management, (4) family structure; (5) Botswana culture and agriculture; (6) awareness and shift of agriculture in Botswana; and (7) perspectives values and motivations. The journey in agriculture was further divided into two sub-themes: (a) significant family experience and how they were raised; and (b) initial agricultural entrepreneurship. The networking and mentoring learning initiatives included two sub-themes: (a) social media; and (b) mentors. Leadership and management was further divided into three sub-themes: (a) leadership style; (b) employee relations; and (c) values and trust. Botswana culture and agriculture had two sub-themes: (a) personal challenges with being a female in the industry and (b) successes. Awareness and shift of agriculture in Botswana was divided into three sub-themes: (a) culture; (b) how Botswana views women in agriculture; and (c) how women in Botswana view agriculture.

In an effort to reduce the impact of bias on the data collected, several validation strategies were employed to document the accuracy of this phenomenological research study. Credibility was established through prolonged engagement in the field and the triangulation of data sources, methods, and investigators (Lincoln & Guba, 1985). From the researchers’ observations, thick descriptions of the women’s life experiences and environments were constructed to help readers determine the transferability of the research. Dependability of the study was established through peer-review by another researcher trained in qualitative analysis who had not conducted the interviews. Additionally, member checks from participants related to data, analyses, interpretations, and conclusions were conducted to confirm credibility of the study (Lincoln & Guba, 1985).

Subjectivity Statement

Prior to launching the study, the eight female researchers reflected on qualities possessed which may have impacted the relationship with women in the study. The researchers hold a strong passion for agriculture and women in the agricultural field, which may result in a more focused analysis on each woman’s journey to their current leadership position. The researchers consist of three full professors, two associate professors, two assistant professors, and one graduate student who are all involved in the agriculture field. Each female involved in the research of this study analyzed the data and have moderate feminist beliefs. To keep a neutral viewpoint and impartial position, the researchers reflected on their biases of the research topic, assumptions of the outcomes of the study, and each occasion of contact with the women agriculturists. In addition, the researchers structured main and probing questions in a way that did not lead the women in their responses.

Findings

Theme One: Journey in Agriculture

The women interviewed were immersed in agriculture learning experiences through their family, which later shaped views and perceptions of the world in which they live and launching them as leaders in their chosen industry. The following results are divided into two sub-themes: (1) significant family experience and upbringing, and (2) initial agriculture entrepreneurship.

Women 1, 2, 7 and 8 explained it was normal for children in their culture to be involved in farming, whether it was milking cows, rearing pigs, or growing a garden. For example, Woman 7 expressed that her love for horticulture came from her mother, because they always had a garden, would plant any fruits or vegetables they could get, and lived by the saying, “anything that you plant, grows.” While it is normal for those currently involved in agriculture to have been raised in a farm setting, three of the eight women interviewed had not been directly exposed to the agricultural industry through their childhood. Instead, their passion for agriculture evolved in adulthood. Woman 3 explained:

I am 28 years old. I grew up in the city, so farming was sort of a luxury to me. I used to live in a flat growing up, so we mostly just seen (sic) vegetables and meat in stores. Then on some holidays my Mom would take us to our grandparents’ house, and then we would go to the farm, which was a surreal experience for me because of growing up in the city.

Not only did some of these women grow up in the city which hindered their exposure to agriculture, but Woman 8 revealed:

I am the first born of four kids, raised by a single mother. I grew up, my whole life in Gaborone, so normally and culturally the farm was always put on the father. Since we had a single mother, we found that we did not get to have a lot of that experience. Because I had a grandfather who had a farm, we would go there and then just come back home because it was right outside of Gaborone. So, I never really got to experience that farm life because I more or less grew up as a city girl. I was fine with it, but when I had my own kids, they did not know anything about animals, and my husband and I discussed that we did not want to live the farm life because of our educational backgrounds.

Although some of these women did not experience agriculture throughout their upbringing, each had an internal passion to pursue a career in agriculture. Four out of the eight women interviewed explained they started their careers not actively involved in the agricultural industry, but began in the agriculture industry due to outside influences who emphasized the importance of agriculture. Woman 5 explained:

I did not see a reason of going to school to do what is already in me, so I did not go to school to do agriculture because we do agriculture ourselves. That is our everyday life. I am beginning to develop a big interest, and in fact the reason why I was invited here is because I asked help (sic) to start a farm. I want a farm and I want to do small stock, like goats, sheep and possibly chickens. It has been in me and I do not know why, but it has been in me and I want to do it. I am determined to do it and to keep small stock, and that is my interest. The plowing part of it is vegetables.

However, some women interviewed initially pursued careers in agriculture. Women 1, 2, 3, 4 and 8 have become successful agriculturists in their specific fields, including poultry, crops and even a petting farm. For example, Woman 8 revealed she wanted to have her own orchard because her grandmother was involved in the agricultural industry and enjoyed it. However, she soon realized her passion for impacting youth through building a petting farm and expressed she “loved what she saw” when she dug deeper into the petting zoo agricultural field.

Theme Two: Networking and Mentoring Learning Initiatives

There are developing networking and mentoring initiatives in Botswana. The eight women interviewed described their networking initiatives mainly existed through WhatsApp and social media sites. However, forming support groups is often difficult due to competitive environments. Woman 3 elaborates:

I have it on social media. The only problem with that is, I am going to group us all into this problem as Botswana we do not like sharing, so we have a problem with that. We have a problem with getting an association together because one farmer may have more chickens than all of us, so if we had to get supply, he would get the supply first. Another problem is getting together, not necessarily stealing ideas, but we are all feeding our chicks the same thing..

Mentoring others in the field of agriculture is slightly new in Botswana. The interpretation from the women interviewed was agriculturists mainly did their own thing. Woman 1:

This (mentoring) is something that is quite new to us because we have been very fragmented as a community in terms of the farming thing. But just recently realized that there are farmers that I did not know were out there that are coming on board and sharing ideas, it is really great. But we did not have that at all. And I think that’s been one of the downfalls of Botswana agriculture, was that   there was not this cohesive group of people, everybody was doing their own thing.

Woman 1 also described that agriculture is on the rise due to agricultural specialists and the mentoring they provide. “There is a chain of agricultural shops here in the country that have some agricultural specialists, which is something we have not had, and they have started a group and there is loads of information coming through on that. “So agriculture is really on the rise here.” However, if you are new to the agricultural industry some women may find it difficult to be accepted into the agricultural circles. Woman 2 explained:

In each and every district, there is an agricultural office. So on our side, there is an agricultural office, but we are supposed to have an association. We will often times find that within an association, those people that have been there before, they make it difficult for other people to join. They often say, ‘Oh I do not know how you are supposed to join’, but it is often the head of the association who is saying that. They say this because they do not want other outside people to join because they want to sell within their own farms and not against contenders (Woman 2).

All eight women believed mentoring was important and needed, especially for young people. However, most agreed mentoring may cause competition within the industry. Woman 8 explained, “mentoring is good, we are just not sure if it will create competition that we are just not looking for.”

Theme Three: Leadership and Management

All eight of these women have seized a leadership role within the agricultural industry. Each woman has a unique leadership style they have developed throughout their journey, and from their experiences as leaders, they also have gained a better understanding of their values. The following results are divided into three sub-themes: (a) leadership style, (b) employee relations, and (c) values and trust.

When asked to describe their leadership style, the women’s responses were diverse. For example, Women 4 stated:

I would say that I am born leader. Yes, I was born a leader. I’ve always been showing          that, even at home. As a first born, you are a leader. You are just a born leader because                         you are leading a family. I ended up developing the leadership skills not at school, but at home because I had to lead my family and lead my siblings. I am just a born leader, and        apart from that, I think the Lord has also just given me that leadership role. Even at     church, the Lord has given me that leadership role.

Whereas, Women 1 expressed she believes in trained leadership.

I feel like I train them and then I give them space, but I show them the value of the customer. Teaching them how to talk with them and interact with them, especially being patient with the children. We have a Facebook page where we receive a lot of comments and questions, so I motivate them to interact with the customers and realize that when they get comments about the staff being amazing, they are not talking about me they are talking about you…Train them, give them space, and tell them that I trust them. If they have challenges, I let them know that I am here.

However, their answers were similar in terms of outlook on leadership and their positional power in the agricultural industry. Woman 2:

I would say my approach is effective. I would call myself a good leader becausebefore, I was working under other people, so I started to tell myself that I wanted to do something different. So, the people that I am above, I am going to make sure I listen to them, and that is what made the difference… I always say to them “I want you to be yourself when you do your job.” I only advise if I feel that is not going to work, but what I normally do is that I lay everything out on the table and then from there, I say “do it the way that you can do it.” After that, I just add what needs to be added

These eight women also have to be effective leaders of those with whom they work and interact, such as their employees or customers. For example, Woman 5 further explained how she cannot serve as a true leader to others until she defines her own leadership abilities:

I lead not because I am at the top; leadership is not about being at the top. You can lead from there, but you can also lead from the bottom. You can lead this and any organization even if you are not the secretary or the president, but you lead from the bottom up. You make sure you are leading others properly because you are leading from the bottom. You do not have to have a title to be a leader. Also, if you cannot lead your own life, then you cannot lead other people. You have to start with your own life and lead your life. Once you start leading in your own life, that is when you can lead other people and help other people.

Most of the women exhibited strong relationships with their employees, as they depend on employee support and work ethic in order to have a successful business. Woman 1 further explained she did not attend college and study agriculture, but her staff has been helpful about positively growing the business. However, some of the women explained difficulties in recruiting and retaining reliable and effective staff members. For example, Woman 3 expressed “we are not your friend nor your parent, you are here to work…It is often difficult to train and keep some of the employees.”

Not only did these eight women have the passion to strive to be successful at what they do, but they valued and put trust into their employees. Some of these women have a weakness when it comes to putting their full trust into their staff while staying loyal to their values, such as Woman 2 who stated she can be too forgiving and lenient at times because she is afraid to get rid of staff who have an unfortunate homelife. Woman 1, however, has customer values in mind when she explained how she strived to keep her business open 365 days a year to make it more appealing and beneficial. Woman 8 revealed being able to depend on and trust your staff, ultimately impacts the customers and the outcome of the business.

I think that one of the things, especially when you own a business, that you will always not be there. I have to trust that things will go, and we have to communicate. If we have young people, staff need to go on their level, talk their language and be with them. We are also very hands-on. It is also special to receive ideas from my staff as well, and I make sure I show my appreciation.

Theme Four: Batswana Family Structure

Woman 3 stated:Agriculture for these eight women involves family and/or is a family operation. “I was excited because I got time to spend with my mother, a lot of time, and it is just very peaceful when you are in an agricultural environment opposed to the hustle and bustle of the city. So that is where I found my new love and passion. I have moved to the farm and I am raising my son there” . In addition, the women spoke highly of their children’s love for agriculture. “I have four kids, three girls and one boy. My boy is someone who is active. We have got chickens at home right now and he is feeding them, and tomorrow he is going to the land to help my mother (Woman 6). Woman 8 expressed that she has two children and “They are really hands-on and they love it [agriculture]…They are always out here helping and getting to know things, and it is really like a family business.”

Some of the women were married and the others were not. However, of the married women, spousal support was crucial to their success in agriculture. Woman 2 stated:

I will say, he is supportive because he knows I do not like driving. When my kids were still in school, and they were in school while I was working, he use(d) to drive me to the farm. Even now sometimes, he will drive me out to the chicken house and even though he does not get out, he still drives me because he knows I do not like to drive.

Woman 1 even commented how she could not operate her agricultural business without her spouse. “I was just saying we could not operate without him. There is a lot of mechanical stuff that does go on, and obviously he is a mechanic at trade and is extremely hands-on. He has his own business, but he is very hands-on with what is going on here.” Woman 8 classified herself as a lucky girl due to her spouse’s support and commitment to her agricultural initiatives.

Theme Five: Botswana Culture and Agriculture

Women agriculturists in Botswana recognized the culture in which they were raised was different than the current cultural climate. These changes have greatly impacted them personally and professionally as challenges and successes have surfaced. The following results were divided into two sub-themes: (a) personal challenges and (2) successes by being a female in the industry.

Most of the women interviewed described Botswana as a difficult country in which to reside because of how they are viewed and treated as agriculturists. Although these women were striving to make a change for other women and youth seeking to be successful agriculturists within the industry, Botswana was making it difficult for them. Woman 3 explained how each part of the industry was viewed differently in Botswana depending on their gender and capability. Woman 3:

Well in the poultry industry, they have made it deserving for women and for the other industries, we can penetrate them but they are mainly for men, like the cows, pork and goats, and yes women can get into them, but we are always put on the backburner. “No women cannot do that.” ‘It’s too much work.’ ‘It’s tough and dangerous.’ ‘You can go try chickens.’ Well they say that it is easier. It is less labor intensive.

Woman 4 also revealed her thoughts on how Botswana was influencing women and the agricultural industry. Woman 4:

Yes, it is men driven. However, women are still going to trade shows and exhibitions where we get to meet with different people from different areas and at different angles. We are also trying to show to other women and youth that they should also come up to these events, and show them how it can help them …The problem is that the government and the associations are not supporting these grants, even though that is where it all starts.

These women have overcome most of the challenges that being a female agriculturist in Botswana presents, and they often achieve great success as women leaders within the agricultural industry. Woman 1 illuminated how food outlets and large customers have helped her business and has brought her successful cash flow. Woman 1 now has the ability to produce and distribute more agricultural products. In addition, Woman 4 expressed advancing her agriculture practice:

There was this occasion that had come up from the government about granting land for tomatoes, so I sort of was juggling and fate just helped me decide to grow tomatoes for about 10 months. Because it was really hard work, I learned that if you can plant a tomato you can do anything. I am actually thinking of doing dairy, but for beginners I want to do chickens, eggs and then broilers.

Theme Six: Awareness and Shift of Agriculture in Botswana

The eight women interviewed have been influenced and impacted by the agricultural industry. The following results are divided into the sub-themes culture, how Botswana views women in agriculture, and how women in Botswana view agriculture.

Botswana’s culture and the women involved in agriculture also have a significant impact on the industry and how the country utilizes its agricultural services. There are some difficulties women in Botswana have faced regarding financial support for their operations, specifically with government funding. Woman 3 further highlighted the problems she has faced trying to request funds from the government to bolster her facility in the agricultural industry.

Yes, it is men driven. However, women are still going to trade shows and exhibitions where we get to meet with different people from different areas and at different angles. We are also trying to show to other women and youth that they should also come up to these events, and show them how it can help them.

She explains bank loans are considered excessively competitive as the government searches for certain criteria the women must meet, and because it is a competition for funds, women can only apply every four years around election season when they have completed the voting process.

There seems to be an alignment of similarities between how Botswana views women in agriculture and how women in Botswana view agriculture, such as overcoming gender stereotypes and cultural differences. However, the women interviewed for this study reported progress in starting to receive the recognition they deserve. Amongst the women interviewed, most of them agreed that it can be difficult working in the industry as gender specifications seem to be a priority in production agriculture, but women were beginning to overcome these assumptions. Woman 7 explained her thoughts on men versus women in the industry.

Back in the olden days, to me men had always been at the forefront as pertaining to farming. What has changed now is the fact that we now live in a world where men are dominating especially in the work environment, finances, and opportunities to obtain resources. Now that farming has become commercial and a lot of money is being made, a lot more men are becoming more interested because they are in better positions. They are in better positions when it comes to getting financing and buying resources needed, it’s definitely changing. Unlike before when it was the women who were not going into the field in order to take care of the children, women are now starting to milk the cows and the goats, go harvest wheat and more.

In Botswana, women were beginning to initiate leadership roles in the agricultural industry as they inspired those around them through impacting the younger generations. Woman 8 revealed her positive outlook on how women in Botswana view agriculture, and how they are starting to overcome obstacles that once held women back in the industry.

I want to believe there is a positive outlook on it, mainly because it is something that is part of our culture. In our cultural background, we have roles for men and women. You will find that with the rise of single mothers, the balancing is done in everything they do. Women are now fulfilling both roles. In Botswana, anybody can do anything. For example, I know a single girl who is a cattle farmer. You can find the opportunities here for women are open.

Theme Seven: Perspectives on Values and Motivations

Most of the women interviewed overcame obstacles from the industry, government, and other businesses to achieve their leadership positions. They had done so by staying faithful to who they were in terms of values and beliefs. Each participant expressed how difficult it can be to face the agricultural industry as a woman. They also shared how relying on their faith and following through with practices they value had the power to keep them motivated to spread knowledge and positivity to those who can make the industry successful in the future.

The values and motivations the of women interviewed also align with their faith perspectives. Most of these women valued trust amongst those with whom they work, their customers, and both the economy and agricultural industry in Botswana. Woman 4 explained how she is preparing for a successful future for not only her business, but as well as herself as she prepares to retire. Woman 4:

Because I was raising these broilers, I want to help with food security and the economy of the county. I am helping by supplying to others, and by being able to do this business management, I have become very proud of myself. And I am starting to build my business back up, for now just to get by, but also for when I retire.

In order to have a successful future in the industry, these women also have motivational desires that will help them grow personally and professionally. Not only do their families and businesses motivate them to do better, but they have achieved individual goals that have pushed them to take on new challenges that have eventually made them successful. Woman 5 explained how you must be the motivator in all aspects of your life in order to build up yourself and those around you. Woman 5:

As a leader, you are the strength of people and because you are their strength… you cannot crash. When you have crashed or when your strength has crashed, where now do others look? Who do they look up to? What is left? Knowing that people are looking up to you, it gives you that energy.

Another great example is Woman 3, who is hoping and working toward taking over for mother when she steps down. She said, “Well, hoping that my mother steps down and that I can take it… When she steps down and when she cannot do it, I will ready to take over.” 

Conclusions

The findings and conclusions from this study were supported by interviews, observations, artifacts collected by the research team while in Botswana. The women developed a niche within their agricultural commodity group and this drove each woman, once established within her field, to be passionate and authentic leaders (Avolio & Gardner, 2004). Also, the eight women highlighted unique views of leadership which include being a positive contributor to the industry; searching for inspiration; encouragement to others; passion about the industry; leading by example; and providing motivation to others. These findings were supported by previous research related to women in agriculture (Brawner et. al, 2020; Kleihauer et al, 2012; Stephens et al., 2018).  Furthermore, these women have cultivated personal leadership tactics through lived experiences and time spent in the agricultural industry, similar to the previous research by Brawner et al., 2020.

The women represented a broad range of production agricultural industries (e.g., animal husbandry and horticultural practices) in Botswana. These findings emphasize participants shared lived experiences of leadership, personal and professional challenges, awareness and shifts in Botswana agriculture, and perspectives on faith and values. Other additional values that influence one’s lived situational experiences were environmental conditions and events and influences of learning experiences contribute to career decision making (Hersey & Blanchard, 1976). Moreover, the situational leadership experience and environment in which a woman is raised can influence and shape her career journey, as well as impact leadership aspirations, similar to previous research studies (Brawner et. al, 2020; Kleihauer et al, 2012; Kleihauer et al., 2013; Stephens et al., 2018).

Women who seek leadership opportunities, specifically those in the agricultural industry, would benefit from understanding how the participants of this study first became inspired and how they were encouraged to seek out advancement in their chosen career path. These shared experiences can communicate a framework for woman who are inspired to lead in the agricultural industry – particularly in international settings. Understanding one’s own journey provides the opportunity for reflection on self-value, and recognition of how to work with and lead others. Furthermore, acknowledgement of women in agriculture as leaders can provide a pipeline to expose and foster other women’s pursuit of agricultural careers.

The eight women in this study strived to accumulate and utilize their unique and desired traits and were faced with the difficult decisions of balancing family roles and fighting for success in the industry. As expressed by Woman 8, “You will find that with the rise of single mothers, the balancing is done in everything they do. Women are now fulfilling both roles.” These eight women had not only faced challenges within their leadership roles, but dealt with interpersonal struggles within the industry. They strived to engage with community partners to form shared networks, inspire other women, and organize knowledge acquisition.

Study participants expressed concern with the opportunities for improved knowledge and resources acquired for present and future women agriculturists. Woman 4 detailed, “Nowadays, I think women should just go out there and try new things because we are capable and we can do it.” Their faith, values, and culture, propel them to encourage, engage, and energize others to develop and enhance their leadership potential in agriculture across Botswana. Last, new leadership initiatives must understand the cultural context of gender roles within agriculture and its intersection with faith and family values. It is obvious from these interviews that (1) leadership training for female headed enterprises is needed; (2) government programs should ensure that women leaders are equally qualified; and (3) that more agricultural extension programs should be developed that support women in agriculture.

Recommendations for Future Research

Future research questions to explore include (1) What are high school initiatives in Botswana related to recruiting females into non-traditional career fields? And (2) What are current youth programming initiatives for mentoring young females in agricultural fields in Botswana? and (3) What mentoring strategies are being effectively utilized to recruit and retain women in agriculture industry fields in Botswana?

References

Avolio, J. B. & Gardner, W. L (2005). Authentic leadership development: Getting to the root of positive forms of leadership. The Leadership Quarterly, 16 (3), 315-338. https://doi.org/10.1016/j.leaqua.2005.03.001

Bogdan, R., & Biklen, S. (2007). Qualitative research for education: An introduction to theories and methods. Pearson Education, Inc.

Botlhale, E. (2020). Gender inequality in Botswana: An unfilled agenda. International Journal of Gender Studies in Developing Societies, 3(4), 361 – 374 https://www.inderscienceonline.com/doi/pdf/10.1504/IJGSDS.2020.109246

Brawner, S., Stephens, C. A., Yamagata-Lynch, L., & Donaldson, J. (2020). Leadership attainment of 14 women in agriculture: A qualitative study. Journal of Leadership, Accountability and Ethics, 17(1), 62 – 86. https://doi.org/10.33423/jlae.v17i1.2791

Carroll, D. E., Stephens, C. A., Stripling, C. T., Sorochan, J. C., & Brosnan, J. T. (2021). Women in turf: A qualitative study examining how women have sustained their leadership role in the turfgrass industry. Journal of Agricultural Education, 62(4), 139-157. https://doi.org/10.5032/jae.2021.04139

Cline, L. L., Rosson, H., Pennington Weeks, P. (2019). Women faculty in postsecondary agricultural and extension education: A fifteen-year update. Journal of Agricultural Education, 60(2), 1-14. https://doi.org/10.5032/jae.2019.02001

Crush, J., Hovorka, A., & Tevera, D. (2011). Food security in Southern African cities: The place of urban agriculture. Progress in Development Studies11(4), 285–305.  https://doi.org/10.1177/146499341001100402

Flick, U. (2014). An introduction to qualitative research. Sage.

Frankel, S. Benjamin, S. & Stephens, C. A. (2021) Crafty women: Exploring how southeastern female brewers navigate emotional labour within the craft beer industry. Annals of Leisure Research, 26(3), 372 – 395. http://doi.org/10.1080/11745398.2021.1902356

Government of Botswana. (2020). Gender disaggregated data. https://www.gov.bw/civil-registration/gender-disaggregated-data

Hovorka, A. J. (2012). Women/chickens vs. men/cattle: Insights on gender–species intersectionality. Geoforum, 43(4), 875–884. https://doi.org/10.1016/geoforum.2012.02.005

Kleihauer, S., Stephens, C. A., & Hart, W. E. (2012).  Insights from six women on their personal journeys to becoming deans of agriculture: A qualitative study. Journal of Leadership Education, 11(1), 64-84.  https://journalofleadershiped.org/wp-content/uploads/2019/02/11_1_Kleihauer-Stephens-and-Hart.pdf

Kleihauer, S., Stephens, C. A., Hart, W. E., & Stripling. C. (2013). How six women deans of agriculture have obtained and sustained their leadership role: A qualitative study. Journal of Agricultural Education, 54(3), 15 – 27. https://doi.org/10.5032/jae.2013.03015

Lincoln, Y. S., & Guba, E. G. (1985). Naturalistic inquiry. SAGE Publications.

Must, E., & Hovorka, A. J. (2019). Co-opting cattle spaces: Women, cattle, and empowerment in Northwestern Botswana. Environment and Planning E: Nature and Space, 2(4), 922–943. https://doi.org/10.1177/2514848619860749

Ntseane, P. (2004). Being a female entrepreneurship in Botswana: Cultures, values, strategies for success. Gender and Development12(2), 37–43. https://doi.org/10.1080/13552070412331332180

Reuters Staff. (2018). New president looks to wean Botswana off dependence on diamonds. https://www.reuters.com/article/us-botswana-politics/new-president-looks-to-wean-botswana-off-dependence-on-diamonds-idUSKCN1H811V

Stephens, C. A., Brawner, S., Dean, A. Stripling, C. T., & Sanok, D. (2018). Reflective journeys of five women agriculturists in Australia: A qualitative study. Journal of Agricultural Education, 59 (1), 271-286. https://doi.org/10.5032/jae.2018.01271

The World Bank. (2020). Labor force participation rate, female-Botswana. https://data.worldbank.org/indicator/SL.TLF.ACTI.FE.ZS?locations=BW-ZA-US.

Wright, H. K. (2003) Qualitative research in education: From an attractive nuisance to dizzying array of traditions and possibilities. Tennessee Education, 32(1), 7–15. https://doi.org/1080/09518390600979273

Investigating the Effects of Cognitive Style on the Small Gasoline Engines Content Knowledge of Undergraduate Students in a Flipped Introductory Agricultural Mechanics Course at Louisiana State University

Whitney L. Figland, Louisiana State University, wfigla2@lsu.edu

J. Joey Blackburn, St. Charles Community College, jblackburn@stchas.edu

Kristin S. Stair, Louisiana State University, kstair@lsu.edu

Michael F. Burnett, Louisiana State University, vocbur@lsu.edu

PDF Available

Abstract

One of the greatest challenges that classroom teachers face has been fostering a learning environment that caters to the needs of diverse learners. Teachers have various teaching methodologies at their disposal, ranging from passive, teacher-centered to active, student-centered strategies. The flipped classroom approach allows for teachers to become the facilitator of learning activities and students to become actively engaged in the learning experience. This transition allows for more student-centered activities to occur in class that enhance students’ critical thinking and problem-solving skills. Team-based learning (TBL) is a modified version of flipped classroom that allows students to work collaboratively to solve complex problems. Content knowledge has long been considered an important prerequisite of higher cognitive functions such as critical thinking, problem solving, and reflective thinking. The purpose of this exploratory study was to explain the effect of cognitive style on the small gasoline engines content knowledge of undergraduate students enrolled in a flipped introductory agricultural mechanics course at Louisiana State University. To test the hypotheses, this study utilized descriptive statistics, including the mean and standard deviation, and independent t-tests. A Mann-Whitney U test was employed to determine the influence of cognitive style on content knowledge. Overall, no differences in content knowledge were found. It is recommended to replicate this study longitudinally to increase statistical power. For practice, educators should employ learning strategies that meet the needs of students with diverse cognitive styles.

Introduction and Literature Review

One of the greatest challenges classroom teachers face has been fostering a learning environment that caters to the needs of diverse learners. To achieve this, teachers have a variety of teaching methodologies at their disposal, ranging from passive, teacher-centered methods to active, student-centered strategies (Schunk, 2012). One relatively new means of active engagement has been through the utilization of flipped classrooms. Some of the first flipped classroom models can be seen emerging into secondary and post=secondary education in the late 1990s and early 2000s after the inception of No Child Left Behind (NCLB) (Frederickson et al., 2005; Strayer, 2007; U.S. Department of Education, 2001). Baker (2000) presented his early version of the “classroom flip” as a new method of teaching that was made possible by an increase in the need for new educational methodologies that better engage learners and the increase in instructional technology availability (p. 4). Similarly, Lage et al. (2000) developed the “inverted classroom” model to invert the classroom structure and better engage students during class (p. 32). In both models, it was suggested to move instructional lecture material out of the classroom and make it available online, thus using class time for the professor to serve as a guide to assist students while providing increased time for application and practice (Baker, 2000; Lage et al., 2000). Over the past two decades, the flipped classroom approach has gained increased attention in secondary and post-secondary education for its student-centered approach and increased emphasis on engagement (Barkley, 2015; McCubbins et al., 2018).

The flipped classroom model allows teachers to become the facilitator of learning activities and the students to become actively engaged in the learning process while still focusing on delivering course content (Connor et al., 2014). This transition can allow for more student-centered activities during class to enhance students’ critical thinking and problem-solving skills (Allen et al., 2011; Hanson, 2006). Additionally, active learning strategies promote a student-centered learning environment by creating opportunities for students to solve problems in a real-world context (Michealsen & Sweet, 2008; Sibley & Ostafichuk, 2015).

In recent years, a new type of flipped classroom has emerged as a version of a traditionally flipped classroom; team-based learning (TBL). TBL has emerged as a flipped classroom technique that allows students to work collaboratively to solve complex problems during class time (Michealsen & Sweet, 2008; Wallace et al., 2014). Similar to traditional flipped classroom models, TBL is a student-centered approach that shifts instruction away from a traditional lecture format to create a student-centered learning environment (Artz et al., 2016; Nieder et al., 2005). In a TBL-formatted course, students take on the responsibility of learning conceptual knowledge outside of class and spend more time applying that knowledge in class as a part of a team (Michaelsen et al., 2004). Essentially, TBL is formatted to provide students with opportunities to learn declarative and procedural knowledge to enhance critical thinking and problem-solving skills (Michaelsen & Sweet, 2008). One aspect of TBL that sets it apart from the traditional flipped classroom is its increased emphasis on accountability (Michaelson et al., 2004). An essential element of TBL is the administration of Individual Readiness Assurance Tests (IRATS) and Team Readiness Assurance Tests (TRATS) that serve as formative assessments after each module to ensure students have engaged with the material.

Despite the many possible applications of TBL to agricultural education, research supporting its use in agricultural education has been limited. McCubbins et al. (2016) conducted a study to examine student perceptions of TBL in an agricultural education capstone course. The findings suggested that students had a positive view of TBL and were highly satisfied with the student-centered learning environment (McCubbins et al., 2016). This study also indicated that working in teams positively impacted student motivation to learn in a collaborative setting (McCubbins et al., 2016). A similar study conducted by McCubbins et al. (2018) found that TBL in agricultural education courses supported the development of critical thinking, motivation to learn, and ability to effectively apply course concepts by undergraduate students. Focusing specifically on agricultural mechanics, a course typically heavily focused on problem solving, Figland et al. (2020a) reported that undergraduate students perceived that TBL supported the development of problem-solving skills and promoted positive collaboration between group members while increasing student self-efficacy in the content area.

The ability to increase critical thinking and problem-solving skills cannot be developed exclusively by integrating specific teaching methods. Instead, the education literature has supported the notion that the cognitive styles of students in classes and educational teams can influence the ability of students to problem solve effectively (Myers & Dyer, 2006; Parr & Edwards, 2004; Thomas, 1992; Torres & Cano, 1994; Torres & Cano, 1995; Witkin et al.,1977). Cognitive styles have typically been defined as an individual’s preferred way of organizing and retaining information to solve problems (Keefe, 1979; Kirton, 2003). The awareness of a student’s cognitive style can be an important factor in the success of their ability to solve problems (Jonassen, 2000; Witkin et al., 1977). In agricultural education, Blackburn et al. (2014) and Lamm et al. (2011) concluded that before educators can understand how to tailor lessons to teach critical thinking and problem-solving skills effectively, they must be aware of varying cognitive styles and understand how to relate those cognitive styles to successful problem solving and critical thinking development. To better understand how problem solving can be developed within agricultural education coursework, cognitive style, and innovative teaching methods can be utilized to develop students’ critical thinking ability (Figland et al., 2020b).

Theoretical Framework

Kirton’s (2003) adaptation-innovation theory (A-I theory) served as the theoretical foundation of this study to aid in furthering the understanding of how critical thinking ability can be tied to TBL teaching methodologies. A-I theory is grounded on the premise that all people are creative and can solve problems, regardless of their preferred cognitive style (Kirton, 2003). Per the theory, cognitive style is a person’s preferred way to think, learn, and solve problems (Kirton, 2003). An individual’s cognitive style is measured through Kirton’s adaption-innovation inventory (KAI). KAI scores that fall below the mean are considered more adaptive, while scores above the mean are more innovative. However, it is important to note that the scale is a continuum, and individuals are never purely adaptive or purely innovative (Kirton, 2003). In other words, two people can have scores below the mean, indicating they are more adaptive compared to the normal distribution of scores, but the individual with the higher score is considered more innovative than the other.

When comparing the more adaptive and innovative, several key distinctions exist in how these individuals prefer to learn and solve problems. More adaptive individuals prefer well-established problems and favor working within the current problem structure (Kirton et al., 1991). These individuals collaborate well with group members and generate ideas that favor consensus (Kirton, 2003). On the contrary, the more innovative prefer less structure to solve the problem and often challenge boundaries (Kirton, 2003; Lamm et al., 2012). More innovative individuals tend to stretch the boundaries of problems and generate ideas outside the current group structure (Kirton, 2003). Often, individuals falling more on the innovative side of the continuum tend to be novel and find different ways to solve problems. Whereas the more adaptive ones tend to be safer, more predictable, conforming, and less ambiguous when solving problems (Kirton, 1999, 2003).

Cognitive style is one’s preferred way of learning and engaging in problem solving tasks (Kirton, 2003). However, learners are often presented with situations in which they must learn or perform outside their preferred style. In these instances, individuals utilize coping behaviors to navigate the environment (Kirton, 2003). Often, this occurs in a setting where the person must work with individuals of diverse cognitive styles. Kirton (2003) described this as the Problem A and Problem B situations. For example, consider students assembled into a team to complete a group project. Problem A is the group assignment, while Problem B is how well the group can navigate their diverse cognitive styles to perform the task.

Little research has existed in agricultural education that investigates the effects of cognitive style on student learning outcomes in a flipped learning environment. A-I theory postulates that cognitive style is unrelated to cognitive capacity; however, little literature has been advanced in agricultural education examining this notion. Further, no literature was found that tested this hypothesis in a flipped classroom setting. As a result, the principal question that arose after reviewing the literature was: How does cognitive style effect the small gasoline engine content knowledge of undergraduate students enrolled in a flipped introductory agricultural mechanics course at Louisiana State University?

Purpose of the Study

The purpose of this exploratory study was to explain the effect of cognitive style on small gasoline engine content knowledge of undergraduate students enrolled in a flipped introductory agricultural mechanics course at Louisiana State University.

The following null hypotheses guided this study:

H01: There were no statistically significant differences in small gasoline engine content knowledge of undergraduate students in an introductory agricultural mechanics course based on cognitive style.

Methodology

Data associated with this study were collected as a part of a larger research project that investigated students’ abilities to solve small gasoline engine-related problems. Specifically, a one-group pretest-posttest pre-experimental design was employed to collect data for this research (Campbell & Stanley, 1963; Salkind, 2010). This design is used widely in educational research when all individuals are assigned to the experimental group and observed at two points (Campbell & Stanley, 1963; Salkind, 2010). The changes from the pre-test to the post-test determine the results from the intervention; however, in this design, there is no comparison group, making it almost impossible to determine if the change would have occurred only from the intervention and not from extraneous variables (Salkind, 2010). Extraneous variables must be considered and dismissed to make any generalizations between the interventions and change (Salkind, 2010).

Population/Sample

The population of this study was all students who enrolled in an introductory agricultural mechanics course at Louisiana State University during the spring semester of 2018 (n = 17) and spring semester of 2019 (n = 15). Overall, one student in the spring semester of 2018 did not complete enough course material to be included in the study; therefore, the participating sample totaled n = 31. Institutional Review Board (IRB) approval was sought and granted. Per IRB, students were notified of this research on the first day of class and were given the opportunity to opt out without penalty. All students were over 18 and elected to provide signed consent to participate in this research.

To test for homogeneity between semesters, independent sample t-tests were conducted on individual cognitive score, age, and students’ pre-course interest survey to determine if the groups were homologous. The t-test analysis found that there were not statistically significant differences between the 2018 and 2019 semesters and cognitive style (p = .109), age (p = .596), and pre-CIS (p = .062), respectively. To test for homogeneity, Levene’s test for equality of error variances was calculated and was not statistically significant; therefore, it was assumed that the variances were almost equal and the groups were similar.

Further, a Chi-Square test was employed to determine if differences existed between the two semesters based on gender (X2 = .313, df = 1, p = .576). Therefore, from the analysis, it is concluded that our population from both semesters was homologous, and subsequently, the data were merged for further data analysis.

While the course was offered through the Department of Agricultural and Extension Education and Evaluation at Louisiana State University, it was advertised throughout the college and university. Table one provides the personal and educational characteristics of students (n = 31) who enrolled in this course during the spring of 2018 or 2019. Overall, these students’ ages ranged from 18 to 24, with 19 (29.0%) and 21(29.0%) being the most reported ages. The majority (n = 17; 54.8%) of students were female, and sophomore (41.9%) was the most frequently reported academic classification.  In all, nine majors were represented in this course, with Agricultural and Extension Education being the most common (41.9%).

Instrumentation

Kirton’s adaptation-innovation inventory (KAI) was used to determine students’ cognitive styles (Kirton, 2003). This instrument consisted of 32 items that asked questions about the individuals’ preferred way to learn. The KAI scores range from 32 to 160 on a continuum from more adaptive to more innovative, with a theoretical mean of 96 (Kirton, 2003). However, the practical mean of the KAI is 95 (Kirton, 2003). Therefore, individuals who score 95 or below are considered more adaptive, while those who score 96 or above are considered more innovative. The instrument has been successfully utilized to determine the cognitive style of a wide variety of individuals from varying backgrounds (Kirton, 2003). Internal reliability of this instrument has been measured through multiple studies. Kirton (2003) reported that after analyzing data from six different population samples with over 2,500 respondents that internal reliability coefficients ranged from .84 − .89. Also, 25 other studies that utilized the KAI showed reliabilities between .83 and .91 (Kirton, 2003).

Due to the nature of this pre-experimental study, it was important to determine the students’ knowledge in small gasoline engine content before and after the intervention. The researcher developed a 30-item criterion-referenced test to test the individual’s knowledge. It should be noted that half of the questions on this test were developed by Blackburn (2013) and further modified to meet the needs of this study. The other 15 questions were developed by the researcher based on the Small Engine Care & Repair textbook written by London (2003), a Small Engines Equipment and Maintenance textbook written by Radcliff (2016), and the Briggs and Stratton PowerPortal website. The criterion-referenced test was formatted using a four-option multiple-choice template, including one correct answer and three distractors. Guidelines offered by Wiersma and Jurs (1990) were followed to ensure the reliability of the criterion-referenced test. Table two provides the factors considered as well as how each was addressed.

Course Structure and Procedures

On the first day of the small gasoline engines unit, the KAI and the 30-item pretest were administered to the students. Due to using TBL as the primary teaching strategy, the students were grouped purposively by cognitive style into teams in which they would remain for the duration of the unit. Teams were developed as heterogeneous, homogeneous adaptive, or homogenous innovative. The course layout was formatted based on Michealsen and Sweet’s (2008) recommendations.

In the small gasoline foci, five individual modules were constructed, including (a) small engine tool and part ID, (b) 4-cycle theory and fuel, (c) ignition and governor systems, (d) cooling/lubrication system, and (f) troubleshooting. After each module, students completed an IRAT to determine their content knowledge retained. After completing the IRAT, the students would join their assigned team and complete the TRAT. During the TRATs, students were allowed to collaborate with other members to come to an agreement on items they may have gotten incorrect. The goal of completing the IRAT before the TRAT was to ensure that all group members of the team contributed equally. At the end of the small gasoline engine unit, the 30-item criterion-referenced test was administered.

Data Analysis

Descriptive statistics were utilized to test this study’s hypotheses, including means and standard deviations and independent sample t-tests. Independent sample t-tests are utilized to compare the means of two independent groups and determine if they are statistically significant. In this study, the t-tests were utilized to determine if the groups from the 2018 and 2019 semesters were homologous and could be merged for further data analysis. Further, Mann-Whitney U tests were employed to determine if there was a statistically significant difference between content knowledge and cognitive style.

Findings

The overall mean of the pretest was 15.58 (51.9%).  The mean of the more adaptive students pretest was 15.48 (51.6%), while the more innovative averaged 15.88 (52.9%). Regarding the post-test, the overall mean was 23.39 (77.9%). The more adaptive students’ average score was 22.96 (76.5%), and the mean post-test score of the more innovative students was 24.63 (82.1%), as presented in Table 5.

A Mann-Whitney U test was employed to determine if a statistically significant difference in content knowledge existed based on cognitive style. This test (see Table 6)determined no statistically significant differences in content knowledge by cognitive style (p = .292) at the .05 level.

Conclusion and Limitations

Overall, the statistical analysis revealed that cognitive style did not affect the small gasoline engine content knowledge of students enrolled in an introductory agricultural mechanics course at Louisiana State University. Therefore, the researchers failed to reject the null hypothesis. This conclusion aligns with the A-I theory in that cognitive style does not relate to cognitive capacity. In other words, one’s preferred style or manner of learning and problem solving does not influence the ability to learn or performance. Similarly, this research aligns with the findings of prior research that investigated factors influencing content knowledge achievement (Blackburn, 2013, 2014; Pate et al., 2004). However, these prior studies did not include a pretest measure of small gasoline engine content knowledge; therefore, they failed to account for pretreatment differences in content knowledge. Further, research should be conducted to compare the TBL method of teaching small gasoline engine content with direct instruction. Due to the lack of a comparison group, it is not known whether students in these semesters would have performed better or worse than similar students taught in a more traditional format. This type of research could allow practitioners greater confidence that, at a minimum, they are not impeding students learning by employing TBL in their classrooms.

This study was conducted during two spring semesters to increase the sample size to enhance statistical power. However, due to enrollment sizes and data attrition, the overall sample was only 31 students. Small sample sizes are a detriment to most parametric statistical tools; however, these data were tested for normality in SPSS. However, due to the low sample size, the statistical power of this research was inherently low, which increased the chance of committing Type-II errors.

An additional limitation of this study was the lack of random selection of participants. Due to the nature of using student enrollment in a particular class, caution must be given when interpreting the findings, and it cannot be generalized past the sample reported in this research. The introductory agricultural mechanics course was required for students majoring in agricultural and extension education and has become an increasingly popular elective for other majors across the university. Students not required to complete this course may have a higher mechanical aptitude or prior knowledge and/or experiences in the content areas, which may influence their performance in the course.

Recommendations

To increase statistical power, it is recommended that this research be extended for a minimum of three more semesters. Depending on enrollments, this would increase the sample size to more than 75 students. A sample size of 75 to 100 would sufficiently increase power. Further, additional variables such as mechanical aptitude should be assessed to determine the impact on content knowledge. Additionally, content knowledge should be utilized as an independent variable to determine its role in students’ problem-solving ability in authentic learning environments. Additional research should determine the effect of these diverse cognitive teams on the ability to generate hypotheses and solve authentic problems. Content knowledge could also be employed in a multiple regression model to determine its impact when hypothesizing and solving contextual problems.

Practitioners should be informed that cognitive styles influence how students prefer to learn and solve problems (Kirton, 2003) but are not related to how well a student learns. Teachers should strive to create learning environments conducive to diverse learners to ensure all students have an opportunity to learn (Roberts et al., 2020). As teachers provide opportunities for diverse learning styles – auditory, kinesthetic, and visual – they should provide opportunities geared toward the more adaptive and innovative problem-solving styles. This would ensure one style preference is not constantly required to employ coping behaviors to succeed. Post-secondary educators should consider TBL if they are interested in flipping an agricultural mechanics course. Results from this study indicated that, based on cognitive style, all students can learn successfully. Further, the use of frequent IRATs and TRATs ensures a level of accountability not normally found in traditional flipped classes.

References

Allen, D. E., Donham, R. S., & Bernhardt, S. A. (2011). Problem-based learning. New Directions for Teaching and Learning, 2011(128), 21−29. https://doi.org/10.1002/tl.465

Artz, G. M., Jacobs, K. L., & Boessen, C. R. (2016). The whole is greater than the sum: An empirical analysis of the effect of team based learning on student achievement. NACTA Journal, 60(4), 405−411. http://www.nactateachers.org/index

Baker, J. W. (2000). The “classroom flip”: Using web course management tools to become the guide by the side. Communication Faculty Publications
https://digitalcommons.cedarville.edu/media_and_applied_communications_publications/15

Barkley, A. (2015). Flipping the college classroom for enhanced student learning. NACTA Journal59(3), 240−244. https://www.nactateachers.org/attachments/article/2312/16%20%20Barkley_Sept2015%20NACTA%20Journal-10.pdf

Blackburn, J. J. (2013). Assessing the effects of cognitive style, hypothesis generation, and the problem complexity on the problem solving ability of school-based agricultural education students: An experimental study (Doctoral dissertation, Oklahoma State University). https://www.proquest.com/docview/1427918810?pqorigsite=gscholar&fromopenview=true

Blackburn, J. J., Robinson, S. J., & Lamm, A. J. (2014). How cognitive style and problem complexity affect preservice agricultural education teachers abilities to solve problems in agricultural mechanics. Journal of Agricultural Education, 55(4), 133−147. https://doi.org/10.5032/jae.2014.04133

Campbell, D. T., & Stanley, J. C. (1963). Experimental and quasi-experimental designs for research. Houghton.

Conner, N. W., Stripling, C. T., Blythe, J. M., Roberts, T. G., & Stedman, N. L. P. (2014). Flipping an agricultural education teaching methods course. Journal of Agricultural Education, 55(2), 66−78. https://doi.org10.5032/jae.2014.02066

Field, A. (2009). Discovering statistics using SPSS. Sage publications.

Figland, W. L., Blackburn, J. J., & Roberts, R. (2020a). Undergraduate students’ perceptions of team-based learning during an introductory agricultural mechanics course: A mixed methods study. Journal of Agricultural Education, 61(1), 262-276. https://doi.org/10.5032/jae.2020.01262

Figland, W. L., Roberts, R., &Blackburn, J. J.  (2020b). Reconceptualizing problem solving: Applications for the delivery of agricultural education’s comprehensive, three-circle model in the 21stCentury. Journal of Southern Agricultural Education Research, 70(1), 1-20. http://jsaer.org/wp-content/uploads/2020/09/70-Figland-Roberts-Blackburn.pdf

Frederickson, N., Reed, P., & Clifford, V. (2005). Evaluating web-supported learning versus lecture-based teaching: Quantitative and qualitative perspectives. The International Journal of Higher Education and Educational Planning50(4), 645−664. https://www.learntechlib.org/p/64947/

Hanson, D. M. (2006). Instructor’s guide to process-oriented guided – inquiry learning. Pacific Crest.

Jonassen, D. H. (2000). Toward a design theory of problem solving. Educational Technology: Research and Development, 48(4), 63−85. http://link.springer.come/article/10.007%2FBF02300500LI=true#page-1

Keefe, J. W. (1979). Learning style: An overview. In Keefe, J. W. (Ed.), Student learning styles: Diagnosing and prescribing programs, (pp.1−17). National Association of Secondary Principals. https://eduq.info/xmlui/handle/11515/10081

Kirton, M. J. (1999). Kirton adaption-innovation inventory feedback booklet. Occupational Research Center.

Kirton, M. J. (2003). Adaption-innovation: In the context of diversity and change. Routlage.

Kirton, M., Bailey, A., & Glendinning, W. (1991). Adaptors and innovators: Preference for educational procedures. The Journal of Psychology125(4), 445-455. https://doi.org/10.1080/00223980.1991.10543307

Lage, M., Platt, G., & Treglia, M. (2000). Inverting the classroom: A gateway to creating an inclusive learning environment. Journal of Economic Education, 31(1), 30–43. https://doi.org/10.2307/1183338

Lamm, A. J., Rhoades, E. B., Irani, T. A., Roberts, T. G., Snyder, L. J., & Brendemuhl, J. (2011). Utilizing natural cognitive tendencies to enhance agricultural education programs. Journal of Agricultural Education, 52(2), 12–23. https://doi.org/10.5032/jae.2011.02012

Lamm, A. J., Shoulders, C., Roberts, T. G., Irani, T. A., Unruh, L. J., & Brendemuhl, J. (2012). The influence of cognitive diversity on group problem solving strategy. Journal of Agricultural Education, 53(1), 18–30. https://doi.org/10.5032/jae.2012.01018

London, D. (2003). Small engine care & repair: A step-by-step guide to maintaining your small engine. Creative Publishing International.

McCubbins, O. P., Paulsen, T. H., & Anderson, R. G. (2016). Student perceptions concerning their experience in a flipped undergraduate capstone course. Journal of Agricultural Education57(3), 70–86. https://doi.org/10.5032/jae.2016.03070

McCubbins, O. P., Paulsen, T. H., & Anderson, R. (2018). Student engagement in a team-based capstone course: A comparison of what students do and what instructors value. Journal of Research in Technical Careers2(1), 8−21. https://doi.org10.9741/2578-2118.1029

Michaelsen, L. K., Knight, A. B., & Fink, L. D. (2004). Team-based learning: A transformative use of small groups. Stylus Publishing, LLC.

Michaelsen, L. K., & Sweet, M. (2008). The essential elements of team‐based learning. New directions for teaching and learning2008(116), 7−27. https://doi.org/10.1002/tl.330

Myers, B. E., & Dyer, J. E. (2006). The influence of student learning style on critical thinking skill. Journal of Agricultural Education47(1), 43−52. https://doi.org/10.5032/jae.2006.01043

Nieder, G. L., Parmelee, D. X., Stolfi, A., & Hudes, P. D. (2005). Team-based learning in a medical gross anatomy and embryology course. Clinical Anatomy18(1), 56–63. https://doi.org/10.1002/ca.20040

Parr, B., & Edwards, M. C. (2004). Inquiry-based instruction in secondary agricultural education: Problem-solving-An old friend revisited. Journal of Agricultural Education45(4), 106-117. https://doi.org10.5032/jae.2004.04106

Pate, M. L., Wardlow, G. W., & Johnson, D. M. (2004). Effects of thinking aloud pair problem solving on the troubleshooting performance of undergraduate agriculture students in a power technology course. Journal of Agricultural Education, 45(4), 1–11. https://doi.org/10.5032/jae.2004.04001

Radcliff, B. R. (2016). Small engines. American Technical Publishers.

Roberts, R.,& Stair, K. S., Granberry, T. (2020). Images from the trenches: A visual narrative of the concerns of preservice agricultural education teachers. Journal of Agricultural Education, 61(2), 324-338. https://doi.org/10.5032/jae.2020.02324

Salkind, N. (2010). Encyclopedia of research design. Sage.

Schunk, D. H. (2012). Learning theories: An educational perspective (6th ed.). Pearson.

Sibley, J., & Ostafichuk, P. (2015). Getting started with team-based learning. Stylus Publishing, LLC.

Strayer, J. (2007). The effects of the classroom flip on the learning environment: A comparison of learning activity in a traditional classroom and a flip classroom that used an intelligent tutoring system (Doctoral dissertation, The Ohio State University). http://rave.ohiolink.edu/etdc/view?acc_num=osu1189523914

Thomas, R. G. (1992). Cognitive theory-based teaching and learning in vocational education.Eric Clearinghouse on Adult Education. https://eric.ed.gov/?id=ED345109

Torres, R. M., & Cano, J. (1994). Learning styles of students in a college of agriculture. Journal of Agricultural Education35(4), 61−66. https://doi.org/10.5032/jae.1994.04061

Torres, R. M., & Cano, J. (1995). Examining cognition levels of students enrolled in a college of agriculture. Journal of Agricultural Education, 36(1), 46−54. https://doi.org/10.5032/jae.1995.01046

U.S. Department of Education. (2001). The condition of education 2001. Author. https://nces.ed.gov/pubs2001/2001072.pdf

Wallace, M. L., Walker, J. D., Braseby, A. M., & Sweet, M. S. (2014). “Now, what happens during class?” Using team-based learning to optimize the role of expertise within the flipped classroom. Journal of Excellence in College Teaching, 25(3), 253−273. http://eric.ed.gov/?id=EJ1041367

Wiersma, W. & Jurs, S.G. (1990). Educational measurement and testing (2nd ed.). Allyn and Bacon.

Witkin, H. A., Moore, C. A., Goodenough, D. R., & Cox, P. W. (1977). Field-dependent and field-independent cognitive styles and their educational implications. Review of Educational Research, 47(1), 1−64. https://journals.sagepub.com/doi/pdf/10.3102/00346543047001001

How do Animal Science Standards Align: A Comparison of South Carolina Standards to AFNR Standards

Kayla N. Marsh, Oklahoma State University, Kayla.marsh@okstate.edu

Christopher J. Eck, Oklahoma State University, Chris.eck@okstate.edu

K. Dale Layfield, Clemson University, dlayfie@clemson.edu

PDF Available

Abstract

Content and performance standards were the basis on which school-based agricultural education (SBAE) teachers develop effective and relevant instruction. These standards prepare students for future agricultural careers and support the needs of the community. The purpose of this study was to determine the extent to which South Carolina SBAE standards align with the national AFNR standards for the animal science career pathway. This study implemented an existing data design, comparing the South Carolina animal science standards and the national AFNR animal science pathway standards through content analysis. Thirty-one percent of standards were written at or above the Applying level, as compared to 95% of the AFNR standards. The analysis of standards demonstrated the lack of rigor in current standards. Although this study highlights concerns with SBAE standards in South Carolina, additional research is needed to see how other states’ standards align with AFNR standards. It is further recommended that teacher educators develop preservice and in-service activities that will prepare SBAE teachers to plan activities and assignments at higher-order levels of thinking.

Introduction

“A standard is both a goal (what should be done) and a measure of progress toward that goal (how well it was done)” (Ravitch,1995, p.7). Standards help teachers design courses and develop objectives to deliver content and evaluate student learning (Nilson, 1998). Specifically, content and performance standards were the basis on which school-based agricultural education (SBAE) teachers, school districts, and state education departments rely. These standards develop effective and relevant instruction to prepare students for future agricultural careers and support the needs of the community (Molina, 2009; Swafford, 2018). To be effective, content standards need to be current to support effective SBAE teachers, build capacity for abstract learning, and prepare students for science, technology, engineering, and math (STEM) based agricultural careers (Swafford, 2018). Judson et al. (2020) defined the process of teachers adapting standards to meet the community’s needs, beliefs, culture, and values as the sensemaking of educational standards. This evidence suggested that strong state standards provide a needed structure to empower teachers while still giving the sensemaking freedom to implement and support student learning (Judson et al., 2020).

The push for national standards started in 1989 with policy goals focused on academic achievement and an increase of rigorous coursework for all students. They prompted the reform of learning expectations and assessment, which led to state and national debate over content, assessment, and evaluation in educational systems (Clune, 1993; Darling-Hammond, 1994; Ravitch, 1995). Many oppose the adoption of national standards for a multitude of reasons, including federal control of educational standards, weak or narrow standards due to political influence, controversial values imposed by the government, and diminishing of teachers’ creativity and ability to connect with students in the classroom because they were forced to teach to an assessment or examination (Ravitch, 1995). These concerns still exist, as well as evidence that strong educational standards indicate learning gains, equity for all students, and increased collaboration and communication of needs (Bloom, 1956; Judson et al., 2020; Ravitch, 1995). Sharing ideas between teachers and educational content developers (i.e., textbook writers, curriculum and software developers, and assessment companies) requires well-defined standards as a guide (Anderson, 2001; Darling-Hammond, 1994; Ravitch, 1995). The debate was further complicated by diverse types of standards that have been ill-defined and vaguely used, but each were essential when creating coherent educational expectations for students (Ravitch, 1995). Specifically, content standards are appropriate when discussing what students should learn, while performance standards relate to measuring the level at which it was learned (Ravitch, 1995). Interrelated but irrelevant without the other is the consistent relationship between content and performance standards, making the process of adopting and revising standards messy (Ravitch, 1995). Therefore, it has become best practice to address the complexity and develop content and performance standards that serve as a strong framework to support SBAE teachers, students, administrators, faculty, and content developers because vague non-measurable standards are an ineffective tool in supporting rigorous and relevant instruction and learning (Anderson, 2001; Judson et al., 2020; Ravitch, 1995; Swafford, 2017).

To support these efforts, the Agriculture, Food, and Natural Resources (AFNR) content and performance standards were developed and supported by the National Council for Agriculture Education (2015). AFNR standards provide a baseline to support SBAE career clusters that incorporate STEM integration for multiple agricultural career pathways (The Council, 2015; Swafford, 2018). The eight different SBAE career pathways align AFNR standards with the components of a comprehensive SBAE program for instruction, career and leadership development (FFA), and Supervised Agricultural Experiences (SAE) with the following national standards to ensure a robust framework of rigor and relevance for SBAE programs: Common Career and Technical Core (CCTC), Next Generation Science Standards (NGSS), Common Core Mathematics (CCSS), Common Core English Language Arts (ELA), National Standards for Financial Literacy and Green/Sustainability Knowledge and Skill Statements (The Council, 2015; see figure 1). Not only were the AFNR standards a thoroughly crafted framework for SBAE teachers, students, and support professionals for classroom instruction, but they were purposely constructed to support the comprehensive model for secondary agricultural education developed by Baker et al. (2012), which includes supervised agricultural experiences (SAE) and leadership and career development through the national FFA organization.

Figure 1
Comprehensive Model for SBAE (Baker et al., 2012)

“Adoption and use of these standards is voluntary; states and local entities are encouraged to adapt the standards to meet local needs” (The Council, 2015, p. 2), ultimately allowing SBAE teachers to prepare students for future STEM careers by providing rigorous and relevant instruction while also meeting the needs of the community and program (Baker et al., 2012; Judson et al., 2020; Ravitch, 1995; Swafford, 2018). According to Swafford (2018), at least one STEM component (i.e., science, technology, engineering, or math) was directly aligned with AFNR standards within each pathway, with science the most prevalent as it was found in six of the eight pathways. Therefore, comprehensive SBAE programs were supported by strong content and performance standards with increased levels of rigor and career preparation through the relationship between AFNR and STEM standards (Baker et al., 2012; Judson et al., 2020; Swafford, 2018).

Theoretical and Conceptual Framework

This study was undergirded by Bloom’s (1956) taxonomy, which established distinct levels of learning and engagement as a hierarchical structure representing six categories, ranging from basic learning objectives (i.e., knowledge of content) to higher-order learning (i.e., synthesis and evaluation; Bloom, 1956; Clemons & Smith, 2017). Bloom formed the basis for early work on the development of instructional objectives, standards, and learning goals for classes and curricula, providing a framework and shared vocabulary for teachers, school districts, and educational content developers (Anderson et al., 2001; Bloom, 1956; Krathwohl, 2002). Each of the six categories of Bloom’s Taxonomy has been defined and represented by an action verb that distinguishes the level of learning and retention taking place, as represented in Figure 2.

Figure 2
Bloom’s (1956) Cognitive Taxonomy

The rigor, relevance, and retention of the content and skills learned increase as we move to the pinnacle of the pyramid represented by the action verb create from the base represented by the action verb remember (Anderson et al., 2001; Bloom, 1956; Krathwohl, 2002). Remember represents cognitive tasks that are more concrete and less abstract, including memorization, recall, and labeling as learning activities. Understanding demonstrates concrete learning through cognitive activities of comparing, contrasting, and explaining. Applying is achieved by organizing, developing, or utilizing concrete concepts learned in a new and abstract situation. Analysis reflects when learning activities ask students to analyze content to make assumptions, conclusions, and simplifications. Evaluation is an abstract process of detailed parts or critical elements to criticize, defend or justify within the learning activity. Create is the abstract use of many dissimilar sources to build, invent, solve, or test within the learning activity (Anderson et al., 2001; Bloom, 1956; Krathwohl, 2002). According to Anderson et al. (2001), we should approach this taxonomy as a guide to communicating the cognitive rigor expected from content and performance standards to construct relevant and effective learning activities and content materials. While the action verb is our first indicator as to the level of rigor associated with a learned activity, the context in which the action verb was used in the standard will impact the level of rigor of the task (Anderson et al., 2001; Bloom, 1956; Krathwohl, 2002). For this study, the hierarchical structure was used to determine the cognitive level of animal science standards in South Carolina compared to that of the national AFNR standards.

Purpose of the Study

The purpose of this study was to determine the extent to which South Carolina SBAE standards align with the national AFNR standards for the animal science career pathway. Three research objectives guided this study: (1) What percentage of South Carolina SBAE standards align with the AFNR standards for animal science; (2) At what level of Bloom’s Cognitive Taxonomy are the South Carolina SBAE standards written; and (3) How does the level of rigor compare between the South Carolina SBAE standards and AFNR standards?

Methods and Procedures

This study implemented a non-experimental existing data design (Privitera, 2020), comparing the South Carolina animal science standards and the national AFNR animal science pathway standards through content analysis. A content analysis allows researchers to analyze written records that outline detailed content (Privitera, 2020), in this case, educational standards. The publicly available electronic documents served as the existing data (Privitera, 2020) being analyzed, which included South Carolina SBAE standards for the Animal Science Career Pathway (South Carolina Cooperative Extension, 2021) and the national AFNR Standards for Animal Science (The Council, 2015).

The research team evaluated the state and national standards to determine the alignment between South Carolina standards and national AFNR standards. The research team consisted of a graduate student with nine years of SBAE teaching experience and two faculty members in agricultural education with over 40 years of combined experience in teaching and preparing students to be effective SBAE teachers. The team aimed to answer the three proposed research objectives through collaborative content analysis. Bloom’s Taxonomy (1956) was the lens used to evaluate the state and national standards by the research team. Using the complete research team to analyze the existing data helps the researchers overcome the potential experimenter bias (Privitera, 2020).

Microsoft Excel was implemented to categorize, compare, and analyze animal science standards through the lens of Bloom’s taxonomy (1956). As the research team analyzed each South Carolina standard, the standard was categorized into one of the 20 performance indicators associated with the eight AFNR content standards for the animal systems career pathway (see Table 1).

Table 1
Agriculture, Food, and Natural Resources (AFNR) Animal Systems Pathway Content Standards

AFNR Standard AFNR Performance Indicator
AS.01. Analyze historic and current trends impacting the animal systems industry AS.01.01. Evaluate the development and implications of animal origin, domestication and distribution on production practices and the environment.
  AS.01.02. Assess and select animal production methods for use in animal systems based upon their effectiveness and impacts. 
  AS.01.03. Analyze and apply laws and sustainable practices to animal agriculture from a global perspective.   
AS.02. Utilize best-practice protocols based upon animal behaviors for animal husbandry and welfare.    AS.02.01. Demonstrate management techniques that ensure animal welfare.   
  AS.02.02. Analyze procedures to ensure that animal products are safe for consumption (e.g., use in food system, etc.).  
AS.03. Design and provide proper animal nutrition to achieve desired outcomes for performance, development, reproduction and/or economic production.      AS.03.01. Analyze the nutritional needs of animals.      
  AS.03.02. Analyze feed rations and assess if they meet the nutritional needs of animals.  
   AS.03.03. Utilize industry tools to make animal nutrition decisions.   
AS.04. Apply principles of animal reproduction to achieve desired outcomes for performance, development and/or economic production.   AS.04.01. Evaluate animals for breeding readiness and soundness.  
  AS.04.02. Apply scientific principles to select and care for breeding animals   
   AS.04.03. Apply scientific principles to breed animals   
AS.05. Evaluate environmental factors affecting animal performance and implement procedures for enhancing performance and animal health.   AS.05.01. Design animal housing, equipment and handling facilities for the major systems of animal production.  
  AS.05.02. Comply with government regulations and safety standards for facilities used in animal production  
 AS.06. Classify, evaluate, and select animals based on anatomical and physiological characteristics.     AS.06.01. Classify animals according to taxonomic classification systems and use (e.g. agricultural, companion, etc.).
   AS.06.02. Apply principles of comparative anatomy and physiology to uses within various animal systems.     
  AS.06.03. Select and train animals for specific purposes and maximum performance based on anatomy and physiology.    
AS.07. Apply principles of effective animal health care.    AS.07.01. Design programs to prevent animal diseases, parasites and other disorders and ensure animal welfare.   
  AS.07.02. Analyze biosecurity measures utilized to protect the welfare of animals on a local, state, national, and global level.    
AS.08. Analyze environmental factors associated with animal production.    AS.08.01. Design and implement methods to reduce the effects of animal production on the environment.   
  AS.08.02. Evaluate the effects of environmental conditions on animals and create plans to ensure favorable environments for animals.   

To address the second research objective, the research team evaluated each South Carolina standard and categorized the taxonomical level (i.e., remember, understand, apply, analyze, evaluate, or create) at which the standard aimed to represent. The percentage of standards at each taxonomical level was then compared to address the final research objective using Microsoft Excel.

Results

Research Objective 1: What Percentage of South Carolina SBAE Standards Align with the AFNR Standards for Animal Science

The first objective sought to identify the percentage of South Carolina SBAE standards aligning with the AFNR standards for animal science. The South Carolina animal science pathway included 19 courses and 150 standards that were analyzed in comparison to the AFNR animal science pathway, which consists of eight standards and 20 performance standards. Ninety-five percent of the AFNR standards were written at or above Bloom’s applying level of taxonomy; in comparison, only 39% of South Carolina standards were written at a comparable level. The majority (57%) of South Carolina standards fell in the lowest taxonomy levels, including 12% at remembering and 45% at the understanding level. Additionally, 14% of the South Carolina standards were written at the applying level, 5% at the analyzing level, 3% at the evaluating level, and 20% at the creating level. Although 20% of South Carolina standards were representative of creating based on the action verbs used, 17 of the 31 (11%) used “Discuss” as the verb, when really it was being used to represent explain, which suggests that the South Carolina SBAE standards belonged to the t (Anderson et al., 2001; Bloom, 1956; Krathwohl, 2002). Sixty-eight percent of South Carolina SBAE standards were at or below the understand level compared to five percent of the AFNR Standards for the animal science pathways after the verb meaning adjustment (see Table 2).

Table 2
Comparison of State SBAE Standards and AFNR Standards at Each Level of Bloom’s Taxonomy

StandardIIIIIIIVVVI
AFNR
    Standard
0%5%35%30%20%10%
South Carolina 
     SBAE
     Standard
     with Adjusted
     Verb Meaning
  12%      56%  14%      5%  3%  9%

Research Objective 2: At what Level of Bloom’s Cognitive Taxonomy are the South Carolina SBAE Standards Written

The second objective explored South Carolina SBAE standards for animal science to be analyzed using Bloom’s taxonomy shown in Figure 1 (i.e., remember, understand, apply, analyze, evaluate, and create). The South Carolina standards align to remember (12%) and understand (56%) levels of rigor, which were limited to basic cognition tasks representing knowledge (Anderson et al., 2001). In addition, the wording of South Carolina SBAE standards and action verbs indicated the intended level of rigor at basic knowledge levels of remember and understand. Eleven percent of standards used the action verb discuss to represent lower cognitive tasks.

Furthermore, South Carolina SBAE content and program standard’s strength and value were hard to measure due to the limited number of standards per each of the 19 courses in the animal science pathway. Courses within the South Carolina SBAE animal science pathway ranged from 46 to zero standards, with an average of eight and a median of six. Additionally, five of the 19 South Carolina SBAE animal science pathway courses had no animal science standards. Table 3 compares the number of standards at each of the six levels of Bloom’s (1956) taxonomy with each of the 19 courses in the animal science career pathway in South Carolina.

Table 3
Comparison of South Carolina SBAE Course Specific Standards at Each Level of Bloom’s Taxonomy                                                                                               

 South Carolina SBAE courseIIIIIIIVVVITotal Standards per course
5624 – Agricultural Science
     and Technology
2400006
5691 – Agricultural and
     Biosystems Science
0720009
5620 – Agricultural Science
     and Technology for the
     Workplace
0000011
5600 – AgriBusiness and
     Marketing             
0000000
5614 – Agricultural Crop
     Production and
     Management
0301105
5660 – Agricultural
     Mechanics
     and Technology
0000000
5663 – Aquaculture3140008
5692 – Biosystems Mechanics
     and Engineering
0000000
5679 – Equine Science212210219
5657 – Food Processing0100001
5646 – Cattle Production06121111
5647 – Farm Animal
     Production
0320027
5612 – Small Animal Care630220646
5613 – Introduction to
     Veterinary Science
55100213
5627 – Soil and Water
     Conservation
1030004
5630 – Soil and Soilless
     Research
0000000
5603 – Animal Science04213010
5621 – Equipment Operations
     and Maintenance
0000000
5608/5609a – Animal Science
     for the Workplace I and II
08200010

Note. aCourse codes 5608 and 5609 represent the same course that is to be taken concurrently within an academic year. For the purpose of our standard analysis, they have been counted as a single and complete course.

Research Objective 3: How does the Level of Rigor Compare Between the South Carolina SBAE Standards and AFNR Standards

The final objective compared the level of rigor between the South Carolina SBAE standards and AFNR standards for the animal science pathway. Ninety-five percent of AFNR standards for the Animal Systems Career Pathway have expected student learning outcomes at or above the applying level, whereas 31% of South Carolina SBAE Animal Science standards were found in corresponding levels of Bloom’s Taxonomy.

Conclusions, Recommendations, and Discussion

Thirty-one percent of South Carolina animal science standards were written at or above the applying level of Bloom’s Taxonomy compared to 95% of the AFNR standards. The analysis of standards demonstrated the lack of rigor in current South Carolina standards, as they were primarily written at or below the understanding level. Comparatively, the AFNR standards were written at or above the applying level of Bloom’s Taxonomy, allowing students to integrate the new knowledge in the future, draw conclusions, and produce their own products. Unfortunately, the South Carolina standards asked students to memorize or recall basic information or describe the material, with students very rarely (less than 31%) getting to the application level. Furthermore, the South Carolina SBAE standard’s strength and value are hard to determine due to the apparent lack of consistent standards or expected quality of written standards in the animal science pathway. The number of standards spanned from zero to 46, with an average of eight standards per course. Additionally, five of the 19 animal science courses had no animal science standards, which represented a vague attempt at a rigorous and relevant framework for supporting SBAE students, teachers, school districts, content developers, and community needs (Molina, 2009; Ravitch, 1995; Swafford, 2018). The concept of vague standards was further exacerbated by unclear and misaligned action verbs with the expected student learning activity, where discuss was used at the level of create to represent higher-order learning activities that were truly explaining basic knowledge at the understanding level (Bloom, 1956; Clemons and Smith, 2017; Judson et al., 2020).

The movement from teacher-led learning activities to student-led learning creates higher-order learning activities that allow students to use and process information abstractly (Baker et al., 2012; Judson et al., 2020; Swafford, 2018). Upon further evaluation of South Carolina SBAE standards, they should be considered incomplete, according to Ravitch (1995), since complete standards must include content and performance standards. Content standards describe what was taught, and performance standards describe the depth and use of that learning (Ravitch, 1995). The two types of standards were connected, and South Carolina standards currently lacked both. Despite the current South Carolina SBAE standards weak level of rigor and clarity in both content and performance standards, standards remain essential for effective teaching (Nilson, 1998), furthering the need to evaluate and revise these standards to provide relevant and purposeful standards for SBAE teachers across the state (Kraftwohl, 2002; Ravitch, 1995).

Perhaps this misguided attempt was purposeful to allow teachers creative freedom in their SBAE program content and teaching, but the current South Carolina standards burden SBAE teachers with the search for relevant frameworks to align content due to its incomplete, weak, and confusing nature. Ravitch (1995) found that teachers and administrators who argue against national content and performance standards actively seek curriculum, textbooks, industry certification, or mandated exams to align their course content. SBAE teachers need and deserve the support provided by clear, consistent, and measurable content and performance standards (Judson et al., 2020; Ravitch, 1995). Further demonstrating that a strong and clear framework of standards can support all involved, but vague, unclear, and unmeasurable standards have little value for teachers and students when it comes to designing lessons that promote abstract learning for STEM integration. This lack of alignment limits the ability to meet the rigor and relevance needed to support SBAE teachers in preparing students for future STEM-based agricultural careers (Baker et al., 2012; Judson et al., 2020; Swafford, 2018).

Developing strong, clear, and realistic content and performance standards can be a messy and complex process, but it is essential to support the success of our SBAE students, teachers, programs, and communities (Judson et al., 2020; Molina, 2009; Ravitch, 1995). Perhaps South Carolina should consider adopting or cross-walking the AFNR standards to support their SBAE programs, as reevaluating and updating the state-level standards will allow teachers an opportunity to increase further the rigor and relevance of SBAE programs across the state. To accomplish this task, it is recommended that a team of SBAE teachers, state agricultural education staff, and faculty be developed. Further research should investigate the level of rigor taught in SBAE classes across South Carolina, comparing the rigor established in the state standards with what has been taught in classrooms. Although this study highlighted concerns with SBAE standards in South Carolina, additional research is needed to determine how other states’ SBAE standards align with AFNR standards. SBAE standards provide a structure for teachers, but the impact of these standards on student performance and outcomes remains unknown, although Swafford (2018) connected the implementation of cross-walked AFNR standards in SBAE teacher preparation programs to increased preparation and STEM integration.

Preservice teacher preparation programs should consider preparing SBAE teacher aspirants to recognize and utilize rigorous and relevant higher-order learning standards. Ultimately allowing them to understand and be better prepared to adapt and find support when standards do not provide enough support, such as those identified in this study. Additionally, SBAE teacher aspirants should be familiar with AFNR standards, as they are aligned with the complete SBAE program (i.e., classroom/laboratory instruction, FFA, and SAE), which serves as a valuable resource. SBAE teacher preparation faculty should consider the current standards in their state and how professional development opportunities cross-walking AFNR standards could benefit the rigor and relevance of SBAE teachers and programs across their state.

Parallel to the recommendations for preservice programs expanding instruction on higher-order learning standards, readiness to teach specific agricultural and natural resources content at higher levels could be an equally challenging issue. In a study by Snider et al. (2021), preservice teachers were surveyed to assess their self-perceived competence to teach different topics in the AFNR standards. Students were found to have a “need for competence enhancement in the Power, Structural, and Technical Systems and the Biotechnology Systems Pathways,” (Snider et al., 2021, p. 44). Other areas preservice teachers indicated gaps in were Agribusiness Systems and Food Products and Processing Systems. In contrast, preservice teachers indicated greater competence in the Natural Resources Systems, Plant Systems, and Animal Systems pathways. Snider et al. discussed that pathways such as Animal Systems were an established curriculum in their state and that preservice teachers sought out skill development opportunities in these pathways. Does self-efficacy of specific AFNR pathways influence the level that state standards were written? 

The Agribusiness Systems career pathway has been noted to have great inservice need for years (Radhakrishna & Bruening, 1994; Joerger & Andreasen, 2000; Layfield & Dobbins, 2002). Further, preservice agricultural education programs have called for increased coursework offerings in agribusiness recently (DiBenedetto et al., 2018; Snider et al., 2021). Might these needs have impacted the lack of alignment between the state and AFNR standards for the Agribusiness and Marketing courses, as shown in Table 3? It is recommended that future research in self-efficacy of AFNR skills areas have any influence on those writing standards for state and national curricula.  

Whether the state program adopts the AFNR standards or chooses to revise its current work, this does not guarantee that the new/revised standards will be taught at the higher levels. Ulmer and Torres (2007) found that SBAE teachers exhibit lower-order (knowledge and comprehension) teaching 83% of the time. The same study found that this is not isolated to agriculture teachers, as science teachers were at the lower levels 84% of the time. Similarly, Cano and Metzger (1995) also found that horticulture teachers were at the lower levels 84% of the time. All of these researchers recommended that SBAE teachers were engaged in professional development that would assist them in developing student activities and assignments that encourage higher-order thinking skills. It is recommended that teacher educators develop purposeful professional development that will prepare SBAE teachers to plan activities and assignments at higher-order thinking levels.

Future research should consider the replication of this study on a state-by-state basis as deemed necessary. Additionally, a mixed method approach could be beneficial to assess teachers’ current level of self-efficacy to implement STEM-based higher-order instruction in SBAE, aligning with Bloom’s (1956) cognitive taxonomy. This study could also establish a repository of resources, materials, and curriculum currently being utilized as a framework to deliver STEM-based higher order instruction, helping prepare future SBAE teachers. Researchers should also consider exploring teachers’ content needs, current curriculum resources, and their perspectives on content and performance standards through qualitative interviews. Finally, as state-level changes are made related to SBAE, teachers’ perceptions of current standards should be considered to support and improve the adoption of new state standards.

References

Anderson, L. W, Krathwohl, D. R., Airasian, P. W., Cruikshank, K. A., Mayer, R. E., Pintrich, P. R., Raths, J., & Wittrock, M. C. (2001). A Taxonomy for learning, teaching, and assessing. Addison Wesley Longman, Inc.

Baker, M. A., Robinson, J. S., & Kolb, D. A. (2012). Aligning Kolb’s experiential learning theory with a comprehensive agricultural education model. Journal of Agricultural Education, 53(4), 1–16. https://doi.org/10.5032/jae.2012.04001  

Blooms, B. (1956). Taxonomy of educational objectives: The classification of educational goals. D. McKay.

Cano, J., & Metzger, S. (1995). The relationship between learning style and levels of cognition of instruction of horticulture teachers. Journal of Agricultural Education, 36(2), 36–42. https://doi.org/10.5032/jae.1995.02036

Clemons, A., & Smith, A. (2016, March 8–13). Recontextualizing Bloom’s Taxonomy: Quantitative measures in formative curriculum. Proceedings of 28th International Conference of Technology in Collegiate Mathematics, pp. 111–142. Pearson Education Inc.  

Clune, William H. (1993). The best path to systemic educational policy: Standard/centralized or differentiated/decentralized? Educational Evaluation and Policy Analysis, 15, 233–54. http://www.jstor.org/stable/1164341

Darling-Hammond, L. (1994). National standards and sssessment: Will they improve education? American Journal of Education, 102, 478–510. https://doi/org/01956744/94/0204-0005

DiBenedetto, C., Willis, V., & Layfield, K. D. (2018, May 15–18). Determining content knowledge needs for professional development of in-service agricultural education teachers in South Carolina. 45th Annual National Research Conference of the American Association for Agricultural Education. Charleston, SC.

Joerger, R. M., & Andreasen, R. (2000). Agribusiness standards: A comparison of the choices of Utah agriscience and technology teachers and agribusiness representatives. Journal of Agricultural Education, 41(3), 23–30. https://doi:10.5032/jae.2000.03023

Judson, E., Hayes, K. N., & Glassmeyer, K. (2020). Understanding how educators make sense of content standards. American Journal of Educational Research, 8(11), 812–821. https://doi.org/10.12691/education-8-11-1.

Krathwohl, D. R. (2002). A revision of Bloom’s taxonomy: An overview. Theory into Practice, 41(4), 212–225. http://doi/org/10.1207/s1543042tip4104_2

Molina, Q. (2009). Program & curriculum standards: Mapping the future of agricultural education. The Agriculture Education Magazine, 81(4), 11–12. https://www.naae.org/profdevelopment/magazine/archive_issues/Volume81/2009_01-02.pdf

Nilson, L. B. (1998). Teaching at its best: A research-based resource for college instructors. Anker Publishing Company.

Privitera, G. J. (2020). Research methods for the behavioral sciences (3rd ed.). SAGE.

Radhakrishna, R. B., & Bruening, T. H. (1994). Pennsylvania study: Employee and student perceptions of skills and experiences needed for careers in agribusiness. NACTA Journal, 4, 15–18. http://www.nactateachers.org/attachments/article/775/

Ravitch, D. (1995). National standards in American education: A citizen’s guide. Brookings.

Snider, C., Robinson, S., Edwards, C., & Terry, R. (2021). Student teachers’ views on their competence to teach the national AFNR career pathways: Implications for the preparation of preservice teachers in agricultural education. Journal of Agricultural Education, 62(3), 34–50. https//doi.org/10.5032/jae.2021.03034

Stanny, C. (n.d.). Action Words for Bloom’s Taxonomy. Retrieved January 13, 2016, http://uwf.edu/media/university-of-west-florida/offices/cutla/documents/Action-Words-

South Carolina Cooperative Extension. (2021). Plant and Animal Pathway. South Carolina Agricultural Education Swafford, M. (2018). STEM education at the nexus of the 3-circle model. Journal of Agricultural Education, 59(1), 297–315. https://doi.org/10.5032/jae.2018.01297

The National Council for Agricultural Education (The Council). (2015). Animal systems career pathway. Author. https://www.teamaged.co/CMDocs/IowaTeamAgEd/Animal%20Systems%20
            Career%20Pathway.pdf

Ulmer, J., & Torres, R. (2007). A comparison of the cognitive behaviors exhibited by secondary agriculture and science teachers. Journal of Agricultural Education, 48(4), 106–116. https://doi.org/10.5032/jae.2007.04106

Technical Professional Development Needs of Agricultural Education Teachers in the Southeastern United States by Career Pathway

D. Barry Croom, University of Georgia, dbcroom@uga.edu

Ashley M. Yopp, Florida Department of Education, ashley.yopp@fldoe.org

Don Edgar, New Mexico State University, dedgar@nmsu.edu

Richie Roberts, Louisiana State University, roberts3@lsu.edu

Carla Jagger, University of Florida, carlajagger@ufl.edu

Chris Clemons, Auburn University, cac0132@auburn.edu

Jason McKibben, Auburn University, jdm0184@auburn.edu

O.P. McCubbins, Mississippi State University, am4942@msstate.edu

Jill Wagner, Mississippi Department of Education, am4942@msstate.edu

PDF Available

Abstract

Determining the professional development needs of teachers framed through the national career pathways of agricultural education has become imperative for modern classrooms. Participants in this study were from six Southeastern U.S. states. Most were female educators, with the largest group having teaching experience between 11-20 years. Participants indicated their professional development needs regarding technical content in the seven agricultural education career pathways. Based on the findings, the researchers concluded that participants needed professional development in plant science, followed closely by animal systems. The least beneficial area for professional development was power, structural and technical systems, and food products and processing systems. No differences existed between male and female teachers regarding their technical professional development needs except within the power, structural, and technical pathway. Teachers with less than 10 years of teaching experience reported a greater need for professional development in animal science than their more experienced counterparts. Finally, participants in rural school systems were more likely to desire professional development on natural resources.

Introduction and Review of Literature

Teachers with a high level of content knowledge are better equipped to help their students succeed academically and can be more effective as educators (National Research Council, 2010). The content knowledge held by teachers has been shown to have a statically significant effect on student learning. When content knowledge is of sufficient depth and quality, the impact on student learning has also been positive (Ambrose et al., 2010). As teachers employ high-quality pedagogical strategies, their content knowledge helps students improve knowledge retention and learning transfer (National Research Council, 2010). In agricultural education, teachers need content knowledge of sufficient depth and breadth to meet the current and future demands of the agricultural industry (Solomonson & Roberts, 2022).

Facilitating Understanding

Teachers with quality content knowledge can help students understand the material more deeply and meaningfully. They can explain concepts clearly, provide relevant examples, and confidently answer questions (Driel, 2021; Gess-Newsome et al., 2019). On this point, Harris and Hofer (2011) found that teachers with more content knowledge were more strategic in selecting learning tasks, created more student-oriented learning activities, and were more deliberate in planning lessons. Pursuing this further, Marzano (2017) proposed that teachers with a high level of content knowledge were more capable of helping students detect errors in their reasoning and successfully solve problems in the real world. Teachers often use content knowledge to guide students to examine how new technical content differs from their existing assumptions. This strategy deepens their understanding of key concepts (Dean & Marzano, 2012; Walshaw, 2012). Ambrose (2010) suggested that content knowledge and intellectual proficiency were key drivers in a teacher’s ability to successfully use technical content to facilitate students’ learning in the classroom. 

Adaptability

Adaptability refers to the ability of teachers to modify their teaching strategies to meet the needs of their students. Teachers with content knowledge can be more adaptable in their teaching. They can adjust their teaching strategies and methods to suit the needs of their students and make adjustments when necessary (Bolkan & Goodboy, 2009). Edgar (2012) postulated that the more content knowledge a teacher possesses, the more likely the teacher would employ varying means to teach the content.

Building Credibility

Building credibility as a teacher has become essential to creating a positive and effective learning environment. Teachers with content knowledge are more credible to their students, parents, and colleagues. The rich source of content knowledge that teachers can draw upon in the classroom has become the source of most of this credibility (Forde & McMahon, 2019). They can speak with authority on their subject matter and inspire confidence in their teaching (Bolkan & Goodboy, 2009; Finn et al., 2009).

Effective planning

Teachers with content knowledge can also create more effective lesson plans and assessments and deploy more effective teaching strategies (Orlich et al., 2012; Senthamarai, 2018). For example, they can design activities and assessments that accurately measure student learning and identify the essential concepts students need to learn (Hume et al., 2019). Previous research has suggested that teacher preparation programs must focus more on understanding how teachers acquire technical content knowledge and support their ability to communicate such to their students (Darling-Hammond et al., 2017; Levine, 2008). For this study, technical knowledge referred to the lesson elements designed to provide students with instruction, practice, and review of information regarding the agricultural sciences.

Agricultural Education Teacher Professional Development Systems

Agricultural education teachers who were traditionally certified often receive technical content training during their initial teacher preparation phase. Formal teacher preparation traditionally begins during college coursework (Croom, 2009). During this period, the preservice teachers are inducted into teaching through training and development (Talbert et al., 2022). However, concerns arise about the ability of novice teachers to deliver content-rich lessons (Roberts et al., 2020a, 2020b). Induction follows the competency-building stage, where technical content skill development continues. This phase is where most professional and skill development occurs (Croom, 2009; Fessler & Christensen, 1992).

Professional development usually involves teachers attending professional development sessions based on their perceived technical content deficiencies (Smalley et al., 2019) because teachers sense their need to address technical content deficiencies through continuous professional development (Easterly & Myers, 2019). Despite this desire to develop technical skills, previous research has found a significant gap in agricultural mechanics skill development and other technical agriculture concepts (Easterly & Myers, 2019; Yopp et al., 2020).

Conceptual Framework

Darling-Hammond et al. (2017) proposed that teacher professional development proceeds through seven elements (see Table 1). Effective professional development employs strategies that deepen a teacher’s technical content knowledge. However, this is not enough. Teachers also need sustained professional development activities of sufficient duration that demonstrate how to teach technical content. Darling-Hammond et al. (2017) further proposed that teachers were best served by professional development provided in a social environment, with teachers collaborating and exploring effective instructional models under expert coaches’ guidance. Teachers needed to reflect on their performance to internalize new content knowledge and the strategies for teaching it (Darling-Hammond et al., 2017). This model for professional development begins with developing technical content knowledge (Darling-Hammond et al., 2017). The research team focused on this element of the model because we contended that professional development was grounded in content skill development applied through effective teaching strategies.

Table 1
Elements of Effective Professional Development adapted from Darling-Hammond et al. (2017)

The connection between professional development in the content taught is that both are needed to support effective teaching practices. Teachers who have a strong understanding of the content they are teaching and who have the skills and knowledge needed to teach that content effectively will be better equipped to meet the needs of their students and support their learning (Ambrose et al., 2010; Darling-Hammond et al., 2017). Additionally, ongoing professional development and content training can help teachers stay up-to-date with the latest research-based practices, teaching strategies, and techniques, which can further improve their teaching practices over time (Darling-Hammond et al., 2002).

The agricultural education curriculum covers a range of grade levels and a wide range of technical content. It provides students with knowledge as the content transitions from more basic to advanced skill development through pathway progression. As a result, secondary agricultural education teachers must provide essential knowledge and experiences through advanced instruction in animal science, agricultural engineering, plant and soil science, forestry, natural resources, food processing, and agricultural business management (Talbert et al., 2022). Therefore, secondary students must have the skills to navigate complex problems regarding agriculture, food, and natural resources using good reasoning skills (Figland et al., 2020). Table 2 illustrates the seven areas of agricultural sciences as identified by Advance CTE (2018) and describes the primary learning attribute guiding the learning activities.


Table 2

Agriculture, Food & Natural Resources Career Pathways adapted from Advance CTE (2021)

Purpose and Objectives

This study aimed to investigate the professional development needs of teachers in the Southeast United States regarding the national career pathways for secondary agricultural education. After describing the demographics of teachers who participated in the study, the objectives were to:

  1. Determine the professional development needs of teachers in the Southeastern region of the United States in each of the seven career pathways described by Advance CTE, and
  2. Compare the professional development needs of teachers by gender, years of teaching experience, and community setting.

Methods

This descriptive study sought to determine teacher perceptions regarding professional development needs as framed by the seven career pathways in the agricultural education curriculum. We distributed an instrument Yopp et al. (2020) developed to the target population of agricultural science teachers in six Southeastern states. We used each state’s directory of agricultural science teachers provided by state agricultural education authorities to define the target population.

We developed the questionnaire to address each research objective, including demographic questions. We included 54 Likert-scale items based on seven career pathways developed by Advance CTE (2018): Power and Technical Systems (16 items), Plant Systems (8 items), Natural Resources (4 items), Food Products and Processing (7 items), Environmental Service Systems (5 items), Animal Systems (7 items), and Agribusiness Systems (7 items). We asked participants to rate each item based on its perceived benefit level using this scale: 1 = not beneficial to 5 = essential. We entered data into SPSS® version 24.0 to calculate means and standard deviations. We conducted further analysis through t-tests to determine the significance between variables of interest.

A panel of agricultural teachers with expert knowledge of Advance CTE career pathways examined the questionnaire for content and face validity. Using methods proposed by Creswell and Creswell (2017), we pilot-tested the questionnaire with a sample of 14 pre-service agricultural education teachers using the test re-test method. These test measures yielded Cronbach’s alpha coefficients ranging from .83 to .91 (.70 or higher acceptable range). Our post-hoc reliability analysis of the instrument yielded an overall valid measure (α = .86).

Guided by Dillman et al. (2014) tailored design method, researchers administered the instrument to prospective participants via email using each state’s unique agricultural education teacher listserv. The research team sent an initial invitation to participate in the study. We followed this with a second message to engage participants through an opt-in email directing them to a Qualtrics hyperlink specific to their respective instrument by state. Lastly, the researchers sent two follow-up reminder emails to non-respondents over four weeks. Previous instrument implementation (Yopp et al., 2020) yielded Cronbach’s alpha coefficients ranging from .83 to .91 (Creswell & Clark, 2017). Post-hoc analysis of the instrument based on the population of interest revealed an overall α = .81.

Due to the nature of school-based agricultural education (SBAE) and participants’ ability to respond in a timely manner, early and late responders were evaluated to determine whether response differences occurred (Lindner et al., 2001). Analysis revealed no differences (p = .45) in the population of interest. The final response rate gained was 52.24 %. We anticipated this because decreased response rates to web-based instruments have been reported, especially in recent decades, with the influx of messaging in professional environments. Baruch (1999) noted that rates have declined from approximately 65% to 48% when using electronic survey methods. On this issue, Fraze et al. (2003) found that SBAE teachers responded less frequently to electronic surveys, possibly due to overloaded work schedules.

Findings

Female participants outnumbered male participants in this study, and most participants were still in their first 10 years of teaching. Most participants received formal training to become teachers through a traditional undergraduate program in agricultural education. Many teachers (n = 107) earned their teacher certification through an alternative certification program. The majority of teachers in this study taught in rural schools. Urban agricultural educators made up the smallest percentage of participants in this study. Table 3 provides a detailed representation of the socio-demographic characteristics of participants.

Table 3
Socio-demographic Characteristics of Participants

Objective One: Professional Development Needs in the Seven Career Pathways

Based on data gathered from SBAE teachers and guided by the career pathway to frame the professional development needs, we found that the essential area was that of Plant Systems (M = 4.17, S.D. = .78) and closely followed by Animal Systems (M = 4.14, S.D. = .98). The career pathway with the least beneficial area for professional development was Power, Structural & Technical Systems (M = 3.26, S.D. = 1.02) with Food Products & Processing Systems (M = 3.46, S.D. = 1.02) having a similar response by respondents. The two lowest career pathways also displayed the most variation of answers, as identified by participants. Table 4 shows the professional development needs of agriculture teachers based on career pathways in agricultural education.

Table 4
Professional Development Needs of Agriculture Education Teachers Based on Career Pathways

Note. 1 indicates a scale used from 1 = Not beneficial to 5 = Essential with 3 = No opinion

Objective Two: Professional Development Needs of Teachers by Gender, Years of Teaching Experience, and Community Setting.

The research team collected data on the professional development needs of participants aligned with career pathways and disaggregated based on gender. Two pathway areas had statistically significant differences based on gender. We found significant differences between genders within the Power Technology (p = .000) and Natural Resources (p = .005) pathways. The remaining pathways did not reveal significant differences based on gender. Table 5 displays the needs for professional development in career pathways by gender.

Table 5
Needs for Professional Development in Career Pathways based on Gender

Note. 1 indicates a scale used from 1 = Not beneficial to 5 = Essential with 3 = No opinion

The research team gathered data on the professional development needs of participants aligned with career pathways and analyzed it based on years of experience. The Animal Systems pathway has significant differences based on experience (p = .005). Although the means reported were similar (4.14 and 4.13), the associated standard deviations were dissimilar (1.07 and 0.86), resulting in statistically significant differences between the groups regarding experience. The remaining pathways did not have substantial differences based on experience level. Table 6 details participants’ professional development needs based on years of teaching experience.

Table 6
Needs for Professional Development in Career Pathways Based on Experience

Note. 1 indicates a scale used from 1 = Not beneficial to 5 = Essential with 3 = No opinion

Participants reported their professional development needs regarding career pathways based on the impact of the community setting. The Natural Resources pathway (p =. 049) indicated significant differences based on the community setting. Table 7 displays the needs for professional development based on the community type.

Table 7
Needs for Professional Development in Career Pathways Based on the Community Type

Note. 1 indicates a scale used from 1 = Not beneficial to 5 = Essential with 3 = No opinion

Conclusions & Implications

This study aimed to investigate the professional development needs of teachers in the national career pathways in agricultural education. The divisions of gender and years of experience do not represent a generalizable representation of each state regarding the professional development needs of agriculture teachers. Participants in this study were from six states in the Southeastern United States. Most respondents were female, with the largest group having teaching experience between 11-20 years. Respondents were experienced and prepared mainly for their teaching career through traditional means.

Participants were asked to indicate their professional development needs regarding technical content in the seven career pathways. Based on the findings, we concluded that professional development was most needed in the specialized content area of plant science, followed closely by animal systems. Meanwhile, we also conclude that the least beneficial areas for professional development were Power, Structural & Technical Systems, and Food Products & Processing Systems. Concerning Power, Structural & Technical Systems, the findings are inconsistent with the results of similar studies (Easterly & Myers, 2019; Smalley et al., 2019) that have reported a significant gap in teacher preparation in this area. However, we conclude from our findings that teachers do not perceive technical training in Power, Structural & Technical Systems to be a significant need.

Further conclusions evoked through this research population werethat no differences exist between male and female teachers regarding their technical in-service training needs, with two exceptions. More males than females found the need for training in natural resources and power and technical systems. Further, teachers with less than 10 years of teaching experience need more training in animal science than their more experienced counterparts. This is consistent with the teacher development model developed by Fessler and Christensen (1992). The only significant difference among respondents for this research objective was that rural teachers rated natural resources training higher than their urban counterparts. We found that teachers in rural schools were more likely to require training on natural resources. This could result from rural teachers’ access to more natural resources and, therefore, more opportunities to teach this content area than a teacher in an urban setting.

Recommendations for Future Research

Based on the conclusions from this study, this study should be replicated in other regions of the United States to gain a clearer picture of the professional development needs of agricultural education teachers. Agriculture operations vary across the United States due to climate, arable land, geography, and access to infrastructure that supports markets and transportation. The teachers in one region may have different professional needs from those in another. This study should be replicated in the future to determine if teacher training needs have changed. The agriculture industry uses human ingenuity and innovation to power new and better methods for producing food, fiber, and natural resources. Consequently, agricultural educators must be well-equipped to educate students using innovative technology.

This study found differences between male and female teachers in power, structural and technical systems, and natural resources. Additional research in this area may help determine why these differences exist. Furthermore, we noted differences between new and experienced teachers concerning animal science. This begs the question as to whether Inservice training needs should be customized based upon the years of experience. Researchers should conduct follow-up studies to determine if this would benefit teachers.

References

Advance CTE. (2018). Agriculture, food & natural resources. Agriculture, Food & Natural Resources. https://careertech.org/Agriculture

Ambrose, S. A., Bridges, M. W., DiPietro, M., Lovett, M. C., Norman, M. K., & Mayer, R. E. (2010). How learning works: Seven research-based principles for smart teaching. Jossey-Bass.

Baruch, Y. (1999). Response rate in academic studies – A comparative analysis. Human Relations, 52(4), 421–438. https://doi.org/10.1177/001872679905200401

Bolkan, S., & Goodboy, A. K. (2009). Transformational leadership in the classroom: Fostering student learning, student participation, and teacher credibility. Journal of Instructional Psychology, 36(4), 296–306. https://eric.ed.gov/?id=EJ952280

Creswell, J. W., & Clark, V. L. P. (2017). Designing and conducting mixed methods research. SAGE Publications.

Creswell, J. W., & Creswell, J. D. (2017). Research design: Qualitative, quantitative, and mixed methods approaches. SAGE Publications.

Croom, B. (2009). The effectiveness of teacher education as perceived by beginning teachers in agricultural education. Journal of Southern Agricultural Education Research, 59, 1-13. http://jsaer.org/pdf/Vol59/2009-59-001.pdf

Darling-Hammond, L., Chung, R., & Frelow, F. (2002). Variation in teacher preparation: How well do different pathways prepare teachers to teach? Journal of Teacher Education, 53(4), 286–302. https://journals.sagepub.com/doi/pdf/10.1177/0022487102053004002

Darling-Hammond, L., Hyler, M. E., & Gardner, M. (2017). Effective teacher professional development. Learning Policy Institute.

Dean, C. B., & Marzano, R. J. (2012). Classroom instruction that works: Research-based strategies for increasing student achievement. ASCD

Dillman, D. A., Smyth, J. D., & Christian, L. M. (2014). Internet, phone, mail, and mixed-mode surveys: The tailored design method (4th edition). Wiley.

Driel, J. V. (2021). Developing science teachers’ pedagogical content knowledge. Brill. https://doi.org/10.1163/9789004505452_001

Easterly, R. G., & Myers, B. E. (2019). Professional development engagement and career satisfaction of agriscience teachers. Journal of Agricultural Education, 60(2), 69–84. https://doi.org/10.5032/jae.2019.02069

Edgar, D. W. (2012). Learning theories and historical events affecting instructional design in education: Recitation literacy towards extraction literacy practices. Sage Open, 2(4), 1–9. https://journals.sagepub.com/doi/pdf/10.1177/2158244012462707

Fessler, R., & Christensen, J. C. (1992). The teacher career cycle: Understsnding and guiding the professional development of teachers. Allyn and Bacon.

Figland, W., Roberts, R., & Blackburn, J. J. (2020). Reconceptualizing problem-solving: Applications for the delivery of agricultural education’s comprehensive, three-circle model in the 21st Century. Journal of Southern Agricultural Education Research, 70(1), 1–20. http://jsaer.org/wp-content/uploads/2021/01/Volume-70-Full-Issue.pdf#page=35

Finn, A. N., Schrodt, P., Witt, P. L., Elledge, N., Jernberg, K. A., & Larson, L. M. (2009). A meta-analytical review of teacher credibility and its associations with teacher behaviors and student outcomes. Communication Education, 58(4), 516–537. https://doi.org/10.1080/03634520903131154

Forde, C., & McMahon, M. (2019). Teacher quality, professional learning and policy: Recognising, rewarding and developing teacher expertise. Palgrave Macmillan. https://doi.org/10.1057/978-1-137-53654-9

Fraze, S. D., Hardin, K. K., Brashears, M. T., Haygood, J. L., & Smith, J. H. (2003). The effects of delivery mode upon survey response rate and perceived attitudes of Texas agriscience teachers. Journal of Agricultural Education, 44(2), 27–37. https://doi.org/10.5032/jae.2003.01027

Gess-Newsome, J., Taylor, J. A., Carlson, J., Gardner, A. L., Wilson, C. D., & Stuhlsatz, M. A. M. (2019). Teacher pedagogical content knowledge, practice, and student achievement. International Journal of Science Education, 41(7), 944–963. https://doi.org/10.1080/09500693.2016.1265158

Harris, J. B., & Hofer, M. J. (2011). Technological pedagogical content knowledge (TPACK) in Action: A descriptive study of secondary teachers’ curriculum-based, technology-related instructional planning. Journal of Research on Technology in Education, 43(3), 211–229. https://doi.org/10.1080/15391523.2011.10782570

Hume, A., Cooper, R., & Borowski, A. (Eds.). (2019). Repositioning pedagogical content knowledge in teachers’ knowledge for teaching science. Springer Singapore. https://doi.org/10.1007/978-981-13-5898-2

Levine, S. (2008). School lunch politics: The surprising history of America’s favorite welfare program. Princeton University Press.

Lindner, J. R., Murphy, T. H., & Briers, G. E. (2001). Handling nonresponse in social science research. Journal of Agricultural Education, 42(4), 43–53. https://doi.org/10.5032/jae.2001.04043

Marzano, R. J. (2017). The new art and science of teaching. Solution Tree Press.

National Research Council (U.S) (Ed.). (2010). Preparing teachers: Building evidence for sound policy. National Academies Press.

Orlich, D. C., Harder, R. J., Callahan, R. C., Trevisan, M. S., & Brown, A. H. (2012). Teaching strategies: A guide to effective instruction. Cengage Learning.

Roberts, R., Stair, K. S., & Granberry, T. (2020a). Images from the trenches: A visual narrative of the concerns of agricultural education majors. Journal of Agricultural Education, 61(2), 324–338. https://doi.org/10.5032/jae.2020.02324

Roberts, R., Wittie, B. M., Stair, K. S., Blackburn, J. J., & Smith, H. E. (2020b). The dimensions of professional development needs for secondary agricultural education teachers across career stages: A multiple case study comparison. Journal of Agricultural Education, 61(3), 128–143. https://doi.org/10.5032/jae.2020.03128

Senthamarai, S. (2018). Interactive teaching strategies. Journal of Applied and Advanced Research, 3(1), 36–38. https://doi.org/10.21839/jaar.2018.v3iS1.166

Solomonson, J. K., & Roberts, R. (2022). Organizing and administering school-based agricultural education systems and the FFA. In A. C. Thoron & R. K Barrick (Eds.)., Preparing agriculture and agriscience educators for the classroom (pp. 17-34). IGI Global.

Smalley, S., Hainline, M., & Sands, K. (2019). School-based agricultural education teachers’ perceived professional development needs associated with teaching, classroom management, and technical agriculture. Journal of Agricultural Education, 60(2), 85–98. https://doi.org/10.5032/jae.2019.02085

Talbert, B. A., Croom, B., LaRose, S., Vaughn, R., & Lee, J. S. (2022). Foundations of agricultural education (4th ed.). Purdue University Press.

Walshaw, M. (2012). Teacher knowledge as fundamental to effective teaching practice. Math Teacher Education, 15, 181–185. https://doi.org/10.1007/s10857-012-9217-0

Yopp, A., Edgar, D., & Croom, D. B. (2020). Technical in-service needs of agriculture teachers in Georgia by career pathway. Journal of Agricultural Education, 61(2), 1–19. https://doi.org/10.5032/jae.2020.02001

Does Experiential Learning Improve Student Performance in an Introductory Animal Science Course?

Eric D. Rubenstein, University of Georgia, erubenstein@uga.edu

Savannah R. White, University of Georgia, savannah.r.white@gcpsk12.org

James D. Scott, University of Georgia, jamesd.scott@uga.edu

C. Robert Dove, University of Georgia, crdove@uga.edu

T. Dean Pringle, University of Florida, td.pringle@ufl.edu

PDF Available

Abstract

At postsecondary educational institutions, the learning process has lecture at the focal point of most courses, for-going experience, and hands-on learning for the more efficient lecture-based model of teaching. A consensus exists among educators that motivation and student engagement can be difficult but remain a crucial part of planning and teaching. Hands-on experiences can be used to motivate students and allow them to gain problem-solving and critical-thinking skills. Therefore, the purpose of this study was to investigate the influence experiential learning had on students enrolled in a large lecture introductory animal science course at the University of Georgia. This quasi-experimental study divided the students enrolled in the course into two groups to determine if experiential learning had a positive influence on the students learning. The experiential learning activities were designed to replace a two-hour study session held each week during the semester. Student performance was measured by the scores on the course summative assessments. The first quiz scores were analyzed by group to determine if a difference was found between the groups. There was no significant difference (p = 0.60) found between the two groups on the first quiz. The researchers found that no significant differences were found between the groups of students on questions related to the four content areas. Therefore, the researchers concluded that experiential learning may not have a positive impact on all learning experiences for students. Therefore, more research should examine the utilization of experiential learning in the teaching of introductory content material to college students.

Introduction and Review of Literature

Kolb explained learning as, “the process whereby knowledge is created through the transformation of experience” (Kolb, 1984, p. 41). Within postsecondary educational institutions, lecture is frequently utilized to foster and facilitate learning in the classroom, indicating the lack of direct experience and hands-on learning in favor of the more efficient lecture-based model of teaching. Further, removing experience-based learning leaves a gap in the development of underclass students at a postsecondary level. According to Kolb (1984), a gain in knowledge is the result of transforming information learned from an experience, implying that learning cannot occur through presentation alone; transformation of experience with the material is required for true knowledge acquisition. Healey and Jenkins (2007) implemented experiential learning in geography in higher education. In their article, the authors outlined the strengths that Kolb’s conceptual frame has for postsecondary institutions. Among the strengths was the benefit of implementing experiential learning into an entire degree program but starting with one course or class session can be equally beneficial for students (Healey & Jenkins, 2007). Students come to a classroom with different learning styles and adaptive natures, but Mainemelis et al (2002) notate that both internal factors (e.g., learning styles) and external factors lead to the acquisition of knowledge and formation of intelligence. Mainemelis et al (2002) also postulated that “intelligence is thus the result of the dialectic integration of internal cognitive organization, reflective abstraction, and external adaptation, active involvement in experience” (p. 7). John Dewey (1938) was the first academic to connect education with experience but warns against the concept that not all experiences are education, which was later explained by Kolb (1984) in his experiential learning model. Dewey (1938) acknowledges that students already have experiences in classrooms, but those experiences lack the depth and character to be learning experiences. To better understand the learning experiences of students in a lecture-based college introduction to animal science course, researchers sought to examine the impact that the integration of experiential learning lessons have on student comprehension of basic animal science topics in comparison to traditional lecture.

A consensus exists among educators that motivation and student engagement can be difficult but remain a crucial part of lesson planning and teaching. Hands-on experiences can be used to motivate students, leading to a gain in problem-solving and critical thinking skills, often acquired through experiential learning activities (Rhykerd et al., 2006), as well as improving student achievement (Stor-Hunt, 1996), the necessary skills to succeed (Barron et al., 2017), and attitudes towards learning (Johnson et al., 1997). In examining how experiential learning can be used to motivate students and the development of problem-solving skills, Rhykerd et al (2006) implemented a hands-on contest with crop production and marketing to help students without an agriculture background gain real-life experience that they can apply to their future careers. The researchers created the contest based on pedagogical research centered around the idea that comprehension can be increased through activities applying real-world situations and critical thinking concepts (Rhykerd et al., 2006). Upon analysis, researchers noted these activities and exercises led to a positive impact on student knowledge development (Rhykerd et al., 2006). Furthermore, in examining the impact of hands-on experiences on student achievement in a middle school science course, Stor-Hunt (1996) determined that students involved in hands-on activities more frequently scored relatively higher on science exams. Additionally, not only does the integration of experiential learning impact student achievement and knowledge development, but these experiences also improve student confidence and self-efficacy (Barron et al., 2017). Veterinary students undergoing their final year of coursework were exposed to real-life appointments, in which they were required to discuss diagnosis and treatment with clients. Researchers concluded a significant increase in confidence and communication skills through the integration of these experiences (Barron et al., 2017). As mentioned, prior research indicated that the integration of hands-on learning also improved student attitudes toward learning. Johnson et al. (1997) concluded that including hands-on learning activities in the classroom was effective in developing positive student attitudes toward academic subjects, and increasing these activities can influence student outcomes in agricultural and science education.

While hands-on experiences are often utilized more frequently in laboratory experiences, circumstances exist in which hands-on, experience-based lessons are removed from courses and replaced with more lecture-based instruction. Therefore, it is important to re-evaluate the use and efficacy of experiential learning in comparison to traditional lecture-based instruction. Furthermore, within agricultural education, the importance of integrating experiential learning opportunities for students is ever important. Osborne (1993) elaborated on the distinct change toward science-based methods in agricultural education through agriscience. He stressed the importance of the incorporation of science into the agriculture industry. Osborne (1993) stated, “our job is not to duplicate science instruction offered by science departments. Our job is to teach science differently, focusing on applications of science in all facets of the broad agricultural industry” (p. 3). A shift towards agriscience and using scientific methods and principles in agriculture education requires a focus on active learning through hands-on activities. Additionally, Shoulders and Myers (2013) concluded that guiding students through experiential learning can enhance their learning in lab settings, increase science literacy, and lead to higher-level thinking, even though laboratory settings have been previously associated with only the development of psychomotor skills. However, Shoulders and Myers (2013) determined that most educators were not engaging their students in experiential learning, leading to a lack of development and acquisition of relevant knowledge. Further research within agricultural education and experiential learning indicated that students who had the experiential learning treatment scored higher on domain-specific creativity and practical use of knowledge, but students who did and did not receive the treatment scored similar on analytical knowledge (Baker & Robinson, 2016). Based on the results, Baker and Robinson (2016) suggested incorporating experiential learning and traditional lecture-based instruction, stating, “combination produces successful student intelligence most effectively” (p. 139). Baker and Robinson (2017) continued their research in an experiential learning approach in an agriculture classroom regarding student motivation, to which the researchers determined that instruction type does not alter student motivation and learning style plays a role in motivation. In the recommendations, the researchers re-emphasized the need for varied instruction to reach students in all learning styles, as well as adequate planning and delivery (Baker & Robinson, 2017).

Although research has indicated the use of experiential learning is important for student development and the acquisition of skills and competencies to be successful, a lack of research examining the integration of experiential learning in college agricultural and animal science courses is limited. A level of accountability existed in incorporating experiential learning into college-level courses (Caulfield & Woods, 2013). Studies have shown positive outcomes of experiential learning through internships (Esters & Retallick, 2013), study abroad (Ingraham & Peterson, 2004), and work-study programs (Ambrose & Poklop, 2015). However, few exist surrounding the implementation of experiential lessons into large, introductory science courses in a university setting. Healy and Jenkins (2000) recommended that research in geography education should examine whether post-secondary students in the twenty-first century identify as having a predominant learning style in the incorporation of experiential learning in a university setting. Additionally, Coker et al. (2017) suggested examining the impact of experiential learning in situations where students are randomly assigned to groups of varying information, as an attempt to eliminate any biases of self-selection, student demographics, and other common traits and characteristics. Therefore, this study aimed to bridge the gap in the literature by integrating experiential education lessons into a large introductory animal science course and examining the impacts on student academic achievement on course tests following the experiential education lesson.

Conceptual Framework

This study was guided by the conceptual framework of experiential learning theory as defined by Kolb (1984), and further elaborated upon by Kolb and Kolb (2005). The process of experiential learning has a perspective that “emphasizes the central role that experience plays in the learning process” (Kolb, 1984, p. 20). Experiential learning is used to solidify the learning experience through four stages as seen in Figure 1: concrete experience, reflective observation, abstract conceptualization, and active experimentation (Kolb, 1984). True learning occurs when individuals have the chance to both the experience, as well as the reflection and transformation of the knowledge (Kolb, 1984). Furthermore, Kolb and Kolb (2005) clarify that experiential learning is not a technique taught to students or a mindless reflection on experience, but rather a philosophy of education. The transformation can be seen in classrooms when students are tested on the knowledge created in experiences. Experiences can be created in classrooms through hands-on activities that are coupled with other teaching methods to help students with varied learning styles. To further explain the factors within experiential learning, Kolb (1984) outlines six characteristics of experiential learning. Learning is:

  1. Described best as a process, not an outcome
  2. Continuously grounded in experience
  3. Requires the resolution of internal conflicts with external stimuli
  4. A process of adapting to external stimuli
  5. Interactions between the person and the environment
  6. The process of creating knowledge

            Two characteristics of Kolb and Kolb’s (2005) description of the Experiential Learning Theory are significant for this study, the facets that learning is conceived by the process of creating knowledge and learning results from interactions between the person and their environment. Additionally, Kolb (1984) posits that learning is best described by the process of creating knowledge and is a continuous process grounded in the experiences of the learner. Kolb (1984) states, “the emphasis on the process of learning as opposed to the behavioral outcomes distinguishes experiential learning from the idealist approaches of traditional education” (p. 26). In examining the application of experiential learning theory in collegiate-level courses, Healey and Jenkins (2007) applaud the theory for being easy to well-developed, and understandable and for its generalizability over single classes or entire degree programs. Additionally, agriculture classrooms and laboratories have used experiential learning as a foundational component for numerous years, as educators have continually utilized varied aspects of the theory and many of the applications to educate students.

Figure 1

Kolb’s (1984) Experiential Learning Model

Purpose and Objectives

The purpose of this study was to investigate the influence experiential learning had on students enrolled in a large lecture introductory animal science course at the University of Georgia.  The National Research Agenda called for research to investigate learning to ensure that graduates are prepared for the 21st-century workforce (Roberts et al., 2016).  This study was guided by the following research objective and hypothesis:

  • Describe the effect of experiential learning activities on student comprehension of content taught in an introductory animal science course.
  • Ho: Students who participated in experiential learning activities will have an equal mean score on the course summative assessments compared to those who did not participate in the experiential learning activities.
  • Ha: Students who participated in experiential learning activities will have a higher mean score on the course summative assessments compared to those who did not participate in experiential learning activities. 

Methods and Procedures

This study was conducted utilizing a quasi-experimental design to ensure that all students in the course were granted the same opportunities and to reduce any effects from this population not being randomized (Campbell & Stanley, 1963). According to Campbell and Stanley (1963), quasi-experimental design studies should utilize a crossover method to ensure that multiple data points are collected from each student in the population. Therefore, the researchers broke the course into four sections and alternated the utilization of experiential learning activities for each of the two groups (Table 1).

Table 1

Experimental Treatments by Group

Content AreaGroupTreatment
ReproductionAExperiential
 BControl
NutritionAControl
 BExperiential
GeneticsAExperiential
 BControl
MeatsAControl
 BExperiential

Course Description

Within the Department of Animal and Dairy Science at the University of Georgia, all students are required to complete an introductory animal science course. However, the laboratory component of the Introductory to Animal Science course was removed from the course nine years ago to help alleviate teaching overloads and budgetary constraints. Therefore, the introductory animal science course has been taught as a standalone lecture-based course, structured to teach the basic animal science material all students need to comprehend before taking more advanced courses. The faculty who have taught the course have extensive experience in teaching laboratory classes and have attempted to enhance their classroom instruction in this course to provide students with a better learning environment.  The class meets three times a week for a 50-minute lecture and students were offered a once-a-week study session that could last up to two hours.

Study Design

To ensure variability among the two groups, students were randomly assigned to one of the two groups, denoted as either A or B. Group assignment was determined during the beginning of the semester, prior to any instruction of course material. Thus, one experimental treatment was designed for this study, where students were either in a control group or an experiential learning group for each of the content areas. The group that received experiential learning lessons were taught utilizing hands-on lessons twice during the unit. The laboratory activities were designed through the lens of Kolb’s experiential learning model, in which the labs were structured to ensure students were given the opportunity to engage in each stage of the model. Students were provided with varied hands-on activities and review sections during the session, which was scheduled during the specified time block for traditional review. Each of the activities were planned to take 105-minutes, to ensure that there was time for questions and further explanation for students without exceeding the 120-minute class period. Activities were taught by faculty in the Department of Animal and Dairy Science alongside faculty from the Department of Agricultural Leadership, Education and Communication, with assistance from the teaching assistants for the course, to ensure that students received instruction in a consistent format for fidelity of experimental treatment. Researchers and faculty developed each laboratory activity to correlate with what was being taught in lecture and would be included on the summative assessments. Activities included the deconstruction of a hog carcass in meat science, the dissection and labeling of male and female reproductive tracts in the reproduction unit, examining breed outcomes of puppies and mice during the genetics unit, and the dissection and evaluation of microbial presence in monogastric and ruminant tracts during the digestion unit. In each lab, students were provided the opportunity to first observe each activity demonstrated by the instructors, upon which they then were able to ask questions and build upon what was learned in the lecture. Students were then able to complete the activity in groups, applying the concepts of what was learned in lecture and the demonstration to their own experience and experimentation, completing the cycle of experiential learning. Instructors provided assistance to students throughout the lab as needed, allowing for the opportunity to develop an understanding of the content and apply what was learned to their experiment.

The traditional review session also took place during the 120-minute period, considered to be the control group, in which the students met with the course teaching assistants to review content during a study session. This review was led by student questions to create buy-in from the students attending. To ensure that students were attending the correct session and for fidelity in the treatments, attendance was taken during each meeting to verify the group assignment and ensure that upon data analysis, student grades were sorted appropriately. If, for any circumstance, students missed an experimental treatment, they were removed from the study. Additionally, students were provided the opportunity to remove themselves from the study altogether, and these students were continually offered the opportunity to attend the traditional review session.    

Data Collection and Analysis

Data were collected through four summative course assessments given throughout the semester during specified exam hours, and a final summative exam given at the conclusion of the semester. Exams were created by faculty in the animal science department and were examined prior to each exam to ensure that content was relative to the experiential learning lessons and review sessions that were taught throughout the semester. The exams were also designed to be in correlation with the objectives of the overall course, which were written according to the understand classification within Blooms Taxonomy rather than the analyze or evaluate classifications (Krathwohl, 2002). The exams and objectives were designed in this way to ensure that students in an introductory course were provided with the opportunity to develop the knowledge and skills necessary to complete advanced classes in their major. The summative assessments were given during designated test sessions that were either two hours in length for a unit exam or three hours in length for the final exam. All assessments presented to students were identical in design and students were asked to indicate whether they were in Group A or B prior to completing the exam. This was done to ensure that there were no external influences on student performance or data analysis. Assessments included a variety of multiple choice, true/false, and short answer questions directly related to the content that was taught during the lecture-based component of the course.

Upon completion of the exams, scores were tabulated and sorted by student and group. Content experts and researchers reviewed each exam for total exam score, as well as the total number of questions that were deemed correct and directly related to what was taught in the course and later reviewed or expanded upon with experiential learning lessons. The total number of content related scores that were deemed correct ranged from 10 to 65 questions, depending on the additional content that was taught during the course, which was anywhere from the additional 90 questions to 35 questions. For the final exam, researchers and content experts separated the exam into content areas, which included 16 nutrition questions, 18 reproduction questions, 16 genetics questions, and 11 meat science questions. After scores were tabulated and entered into spreadsheets, data were then analyzed using SPSS version 25 with an a priori level of .05.  

Results

Prior to the study, quiz scores from the first quiz given in the course were analyzed by group to determine if a difference was found between the groups. There was no significant difference (p = 0.60) found between the two groups on the first quiz. Additionally, as previously stated, due to this being an introductory course, students entered the course with either no prior knowledge or limited knowledge from high school curricula. Therefore, because the quiz scores were determined to have no significant difference, the groups were deemed similar and the study groups were deemed appropriate for this study.

After completion of each exam, and tabulation of scores, researchers examined mean scores for each of the content areas within the summative assessments. Mean scores between the groups varied in regard to the difference between the scores, with the largest difference being between the groups within the reproduction content area. The mean score of the treatment group was 40.33 (SD = 4.21) and the mean score for the control group was 39.33 (SD = 3.55). Table 2 displays the mean scores for content area based upon group assignments.

Table 2

Student Assessments Mean and Standard Deviations for Each Content Area

Content AreaGroupnMean (SD)
ReproductionExperiential3940.33 (4.21)
 Control4239.33 (3.55)
NutritionExperiential4242.43 (4.46)
 Control3943.13 (4.62)
GeneticsExperiential3937.77 (3.67)
 Control4237.17 (3.99)
MeatsExperiential4213.52 (2.71)
 Control3914.05 (2.84)

To further examine the data, an independent sample t-test was run to determine if significant differences existed between the control and experimental groups for each content area. The independent samples t-test showed that no significant differences existed between the control and experimental groups on the four content questions. Further examination was conducted at the question level and found that only four total questions were found to have a significant difference at the .05 level. Table 3 displays the results of the independent samples t-test for each content area.

Table 3

Independent Samples t-test – Mean Scores on Each Content Area Between Groups

Content AreaFtdfp
Reproduction.711.1574.59.25
Nutrition.13.6978.05.49
Genetics.08.7178.99.48
Meats.41.8677.84.40

Upon completion of individual summative assessment analysis, researchers then examined final exam scores. Exam questions were divided into each content area, and then mean questions correct and standard deviation were calculated per group (Table 4).

Table 4

Mean Questions Correct and Standard Deviation for Final Exam

Content AreaGroupnMean (SD)
ReproductionExperiential (A)3912.67 (3.35)
 Control (B)4212.74 (3.12)
NutritionExperiential (B)4212.12 (2.33)
 Control (A)3912.05 (2.53)
GeneticsExperiential (A)3912.82 (1.67)
 Control (B)4212.28 (2.08)
MeatsExperiential (B)428.48 (2.71)
 Control (A)397.95 (2.84)

After examining the overall mean and standard deviation per group by content specific questions deemed correct on the final exam, researchers then analyzed the data, using an independent samples t-test. This was done to determine if there were any significant differences between the two groups, in which the results of this analysis revealed there was no significant differences within any content area (Table 5).

Table 5

Independent Samples t-test – Mean Scores on Each Content Area Between Groups

Content AreaFtdfp
Reproduction.002.0979.46
Nutrition.040.1379.45
Genetics1.081.2779.10
Meats.410.8679.19

Conclusions

Based on the results of the study, the researchers fail to reject the null hypothesis, as there were no statistically significant differences in assessment scores between the group that received experiential learning activities in the laboratory session and the group that did not. Although the researchers determined there were no statistically significant differences in the teaching methods used for the lecture and review group, and the lecture and experimental group, the nature of the course was to create a baseline of knowledge for students to continue in their degree program where further experiential learning activities were used more frequently.

As noted, faculty within the animal science department at the University of Georgia designed the overall course utilizing lower levels of Bloom’s Taxonomy (Krathwohl, 2002), utilizing lecture-based instruction to provide students with the opportunity to develop the knowledge and skills to be successful in more complex courses in students’ program of study. However, within the implementation of this study, researchers and faculty integrated hands-on experiential components in the overall design of the course, to provide students the opportunity to develop knowledge at the analysis and evaluation classification (Krathwohl, 2002). While the researchers sought to determine whether or not experiential learning impacted student performance and success (Barron et al., 2017; Stor-Hunt, 1996), the development of skills and knowledge (Rhykerd et al., 2006), and attitudes towards learning animal science content (Johnson et al., 1997), researchers determined that the experiential learning sessions were not implemented appropriately. Because of this, the discrepancies between the exam questions and the knowledge presented in the laboratory sessions should be noted for future studies and additional implementation of experiential learning in an introductory animal science course.

Among the students in the course, whether participation occurred in laboratory sessions or the traditional review session, there was no statistically significant difference in knowledge comprehension between the control and experimental groups. However, there was evidence that a few individual questions may reflect a benefit in hands-on experiences for some content areas, as the results from the nutrition, genetics, and meat science assessments revealed a higher average of questions correct from these activities. Additionally, it is evident that some experiential learning activities provide students with the opportunity to develop more content related knowledge and improve scores on summative assessments. Although researchers noted an increase in student assessment scores, it can be concluded that in this study, experiential learning does not always impact student success and knowledge gain.

Experiential learning is a beneficial teaching method that uses hands-on experiences to create knowledge and provide all students with the opportunity to develop skills and confidence to succeed in the classroom and beyond (Mainemelis et al., 2002). As previously stated, the results of this study did not indicate significance in student performance between groups, however, it should be noted that the use of experiential learning activities in laboratory sessions alongside lecture provides students with further opportunities to acquire the necessary knowledge and skills. Further, the instructors of the course utilized their personal experiences within the animal science field to provide real-world examples for students to imagine the practicality of the content being taught.  Therefore, the researchers conclude that true engaging lecture can be an effective tool in college classes (Estepp et al., 2014). 

Recommendations for Practice and Research

From the results of this study, researchers identified recommendations for future studies, which include replicating the study with modifications to the study design and data collection and replicating the study with modifications to the lessons taught in lab alongside guided directions for teaching assistants and instructors, to minimize the external influences on student knowledge development and skill acquisition. Additionally, researchers recommend future studies examining the performance of students on summative assessments when content and assessments are structured around hands-on learning experiences. Researchers also noted the importance of longitudinal research within the use of experiential learning laboratories on student performance, and recommend that in additional study replication, students enrolled and participate in the introductory course with experiential learning laboratories are observed throughout other animal science courses for performance.

The researchers also determined the need for recommendations for practitioners in college-level animal science courses, including the use of hands-on laboratory sessions to accompany traditional lecture-based instruction and review in introductory courses.

References

Baker, M. A. & Robinson, J. S. (2016). The effects of Kolb’s experiential learning model on successful intelligence in secondary agriculture students. Journal of Agricultural Education, 57(3), 129-144. https://doi.org/10.2032/jae.2016.03129

Baker, M. A. & Robison, J. S. (2017). The effects of an experiential approach to learning on student motivation. Journal of Agricultural Education, 58(3), 150-167. https://doi.org/10.5032/jae.2017.03150

Barr, R. B. & Tagg, J. (1995). From teaching to learning: A new paradigm for undergraduate education. Change, 27(6),13-25. https://doi.org/10.1080/00091383.1995.10544672

Barron, D., Khosa, D., & Jones-Bitton, A. (2017). Experiential learning in primary care: Impact on veterinary students’ communication confidence. Journal of Experiential Education, 40(4), 349-365. https://doi.org/10.1177/1053825917710038

Campbell, D. T., & Stanley, J. C. (1963). Experimental and quasi-experimental designs for research on teaching. Houghton Mifflin.

Dewey, J. (1938). Experience and education. Touchstone

Estepp, C. M., Shelnutt, K. P., & Roberts, T. G. (2014). A comparison of student and professor perceptions of teacher immediacy behaviors in large agricultural classrooms. NACTA Journal, 66(2), 155-162. https://www.jstor.org/stable/pdf/nactajournal.58.2.155.pdf

Healey, M. & Jenkins, A. (2007). Kolb’s experiential learning theory and its application in geography in higher education. Journal of Geography, 99(5), 185-195. https://doi.org/10.1080/00221340008978967

Johnson, D. M., Wardlow, G. W., & Franklin, T. D. (1997). Hands-on activities versus worksheets in reinforcing physical science principles: Effects on student achievement and attitude. Journal of Agricultural Education, 38(3), 9-17. https://doi.org/10.5032/jae.1997.03009

Kolb, A. Y. & Kolb, D. A. (2005). Learning styles and learning spaces: Enhancing experiential learning in higher education. Academy of Management Learning and Education, 4(2), 193-212. https://doi.org/10.5465/amle.2005.17268566

Kolb, D. A. (1988). Experiential learning: Experience as the source of learning and development. Prentice-Hall Inc.

Krathwohl, D. R. (2002). A revision of Bloom’s taxonomy: An overview. Theory into Practice, 41(4), 212–218. https://doi.org/10.1207/s15430421tip4104_2

Mainemelis, C. Boyarzis, R. E., & Kolb, D. A. (2002). Learning styles and adaptive flexibility: Testing experiential learning theory. Management Learning, 33(1), 5-33. https://journals.sagepub.com/doi/pdf/10.1177/1350507602331001

Osborne, E. (1993). Rediscovering our niche. The Agricultural Education Magazine, 66(4), 3-12. https://www.naae.org/profdevelopment/magazine/archive_issues/Volume66/v66i4.pdf

Rhykerd, R. L., Tudor, K. W., Wiegand, B. R., Kingman, D. M., & Morrish, D. G. (2006). Enhancing experiential learning through a hands-on crop production and marketing contest. North American Colleges and Teachers of Agriculture, 60(4), 25-30.

Roberts, T. G. (2006). A philosophical examination of experiential learning theory for agricultural educators. Journal of Agricultural Education, 47(1), 17-29. https://doi.org/10.5032/jae.2006.01017

Roberts, T. G., Harder, A., & Brashears, M. T. (Eds). (2016). American Association for Agricultural Education national research agenda: 2016-2020. Gainesville, FL: Department of Agricultural Education and Communication.

Shoulders, C. W. & Myers, B. E. (2013). Teachers’ use of experiential learning stages in agricultural laboratories. Journal of Agricultural Education, 54(3), 100-115. https://doi.org/10.5032/jae.2013.03100

Stor-Hunt, P. M. (1996). An analysis of frequency of hands-on experience and science achievement. Journal of Research in Science Teaching, 33(1), 101-109. https://doi.org/10.1002/(SICI)1098-2736(199601)33:1<101::AID-TEA6>3.0.CO;2-Zopen_in_new

Investigating Science Efficacy Before and After a Professional Development Program focused on Genetics, Muscle Biology, Microbiology, and Nutrition

Jesse Bower, Fresno State, jessebower@csufresno.edu

Bryan A.  Reiling, University of Nebraska-Lincoln, breiling2@unl.edu

Nathan W. Conner, University of Nebraska-Lincoln, nconner2@unl.edu

Christopher T. Stripling, University of Tennessee, cstripli@utk.edu

Matthew S. Kreifels, University of Nebraska-Lincoln, matt.kreifels@unl.edu

Mark A. Balschweid, University of Nebraska-Lincoln, mbalschweid2@unl.edu

PDF Available

Abstract

This study investigated teachers’ levels of Personal Science Teaching Efficacy (PSTE) and Science Teaching Outcome Expectancy (STOE) using the Science Teaching Efficacy Beliefs Instrument (STEBI). The population included 10 teachers completing an Increasing Scientific Literacy through Inquiry-Based Professional Development in Genetics, Muscle Biology, Microbiology, and Nutrition. Assessments were made at two points. First, the participants were assessed by using a pretest followed up by a posttest 12 months later after implementing the new curriculum. The teachers experienced gains during the professional development on both their personal science teaching efficacy and their science teaching outcome expectancy. However, the mean differences were not statistically significant. Results of this study indicate that the Increasing Scientific Literacy through Inquiry-Based Professional Development may be used as a tool to increase PSTE and STOE in agricultural educators and science teachers.

Introduction/Theoretical Framework

In the 2020-2021 school year, the Nebraska student-centered assessment in the area of science indicates that only 50% of high school students meet the science expectation (Nebraska Department of Education, 2022). The lack of science proficiency is not surprising given the statistics from 2017 indicating students’ proficiency gradually decreases between 5th grade, 8th grade, and 11th grade (Nebraska Department of Education, 2017). In 2017, 28% of 5th graders were below proficient, 32% of 8th graders were below proficient, and 39% of 11th graders were below proficient (Nebraska Department of Education, 2017). Proficiency scores indicate that science efficacy needs to be addressed at all grade levels, but specifically at the high school level. Based on research and theory, it is determined that outcome expectancy (OE) and science efficacy (SE) are complementary factors in determining the success of teachers in a science-based classroom. (Stripling & Roberts, 2013)

Teacher self-efficacy relates to progressive teaching behaviors and positive student outcomes. Therefore, the social cognitive theory serves as the theoretical framework for this study. The social cognitive theory identifies the capabilities of humans, and their purposeful intentions, that can and will affect their course of action (Bandura, 1977, 1997). This process is called triadic reciprocal causation and was developed by Albert Bandura (1977, 1997). Triadic reciprocal causation suggests three interrelated factors that mutually impact people: environmental, behavioral, and personal factors (Bandura, 1977, 1997). These three factors determine what a person believes about themselves and aide in their decision-making process (Bandura, 1977, 1997). Triadic reciprocal causation advocates that no one single factor determines a person’s behavior, instead, it is the combination of all three factors (Bandura, 1977, 1997). When determining OE and SE, behavior could be predicted (Bandura, 1997) and efficacy beliefs help dictate motivation (Maehr & Pintrich, 1997; Pintrich & Schunk, 1996). Self-efficacy theory helps outline what motivates a person (Graham & Weiner, 1996), and so, the theory can be applied to any behavioral task and predict what will take place.

In the teacher efficacy belief literature, two dimensions of teacher self-efficacy, including Teaching Efficacy (Outcome Expectancy) and Personal Teaching Efficacy (Self- Efficacy), have been defined and utilized in subsequent studies. Several studies suggest that teacher efficacy beliefs may account for individual differences in teacher effectiveness (Armor et al., 1976; Berman & McLaughlin, 1977; Brookover et al., 1978; Brophy & Evertson, 1981). Student achievement has also been shown to be significantly related to teacher efficacy beliefs (Ashton & Webb, 1983). The measurement of Personal Teaching Efficacy has been used to predict teacher behavior with accuracy (Ashton et al., 1983).

Teachers’ content knowledge affects student learning (Ballou & Podgursky, 1999; Ma, 1999; Podgursky, 2005); therefore, science teachers are expected to be highly qualified in the subject area in which they teach. Not only do teachers need to have a high level of comprehension in the content area, but they also need to display passion and enthusiasm. Additionally, standardized tests, only prove that students can memorize and focus on the content because the performance goals measured only address low levels of learning (Meece et al., 2006).

Teacher self-efficacy has also been connected to beginner agriculture teachers’ pledge to the teaching career (Knobloch & Whittington, 2003). Teaching efficacy is a more specific type of self-efficacy (Stripling & Roberts, 2013; Stripling et al., 2008), and is a teacher’s belief in their competence to facilitate the learning environment and produce desired learning results (Guskey & Passaro, 1994; Soodak & Podell, 1996). Beginning teachers who are more efficacious tend to have a greater obligation to teaching than those who are not as efficacious and consequently are more motivated to remain in the teaching profession (Whittington et al., 2003). In fact, beginner teachers could have an exaggerated sense of self-efficacy because of their student teaching experience (Knobloch, 2006).

This professional development program utilized inquiry-based learning as the main instructional approach. There have been numerous studies that show inquiry-based learning is an effective method for teaching science (Keys & Bryan, 2001). Inquiry-based learning requires students to manage their own learning and their success will be based on their engagement in the lesson through active listening and problem solving. Inquiry-based learning opportunities provide the foundation for students to make observations, pose questions, compare evidence, predict outcomes, and communicate research results (National Research Council, 2000).

Purpose/Objectives

The purpose of this study was to determine the teachers’ level of science efficacy in the agricultural education and science classrooms and compare the results as the teachers progressed through the yearlong professional development. The modified science teaching efficacy scale (based on Enochs & Riggs, 1990) consists of both personal science teaching efficacy (PSTE) and science teaching outcome expectancy (STOE).

Objectives include:

  1. Investigate secondary life science teachers’ personal science teaching efficacy (PSTE) within the sciences before and after the Increasing Scientific Literacy through Inquiry-Based Professional Development in Genetics, Muscle Biology, Microbiology, and Nutrition.
  • Investigate secondary life science teachers’ science teaching outcome expectancy (STOE) before and after the Increasing Scientific Literacy through Inquiry-Based Professional Development in Genetics, Muscle Biology, Microbiology, and Nutrition.

Two null hypotheses were used to guide this inquiry:

H01: There is no significant difference in the personal science teaching efficacy (PSTE) of life science teachers before and after the Increasing Scientific Literacy through Inquiry-Based

Professional Development in Genetics, Muscle Biology, Microbiology, and Nutrition treatment.

H02: There is no significant difference in the science teaching outcome expectancy (STOE) of life science teachers before and after the Increasing Scientific Literacy through Inquiry-Based

Professional Development in Genetics, Muscle Biology, Microbiology, and Nutrition treatment.

Methods/Procedures

Professional Development

This professional development (PD) program provided an opportunity for high school agricultural education teachers and science teachers to participate in a 12-month long PD. Applicants were encouraged to join the program with both a science and agriculture teacher from their school. The purpose of this was to bridge the gap between agriculture and science disciplines. After applications were submitted, there were not enough paring entries from all the same schools, so science and agriculture teachers were coupled from different schools (N = 10). For this study, the participants will be referred to as life science teachers. Applicants were recruited in the Spring of 2017. The project was divided into three phases.

Phase I

The PD program began in summer 2017 with a one-day workshop that took place at three different locations throughout Nebraska. The workshop introduced information centered around how students learn, more specifically, experiential learning, short-term and long-term memory, Bloom’s taxonomy, and learning styles. From there, the inquiry-based learning teaching method was introduced. All learning activities that were developed and used in this PD incorporated inquiry-based learning and allowed teachers to experience learning activities as students.

Basic scientific disciplines including biology, chemistry, and mathematics are interrelated in the growth and development of living beings.  For this reason, scientific units of study that focused on the Scientific Principles of Food Animal Systems were developed. The following units were included:

  1. Genetics
  2. Growth & Development / Chemistry of Muscle Biology

3)   Microbiology of Food Safety

4)   Physiology and Chemistry of Nutrition

Each unit provided basic content knowledge, hands-on inquiry-based learning activities, and student reflection instruments.  Content knowledge included educational videos and PowerPoint slides that could be used to introduce high school students to the topic and provided the scientific basis of the topic and related activities. Instructional materials also included a listing of necessary supplies and equipment, ordering information, and easy-to-follow instructions.  For those secondary life science educators that participated in the PD, selected supplies that would not normally be present in a typical high school science laboratory were provided to facilitate the small-group student learning activities. 

Finally, through inquiry-based learning, it is imperative that high school students be asked to reflect upon what they’ve just learned; to evaluate the results and to project how those results might relate to new situations or scenarios (Kolb, 1984).  To facilitate this final component of inquiry-based learning, instruments were developed to encourage high school students to reflect upon what they just learned and how that new knowledge may be applied to different situations in the future. Scientific principles related to genetics, muscle biology, microbiology, and nutrition were used to demonstrate a hands-on, inquiry-based learning pedagogy. 

Phase II

The program continued throughout the 2017-2018 academic year. Conference calls through Zoom, a video conferencing platform, took place in August and December of 2017, and April of 2018. The calls were used to discuss how life science teachers were implementing the prescribed learning activities that focused on genetics, muscle biology, microbiology, and nutrition.

Phase III

Life science teachers were placed in small teams and asked to develop additional inquiry-based learning activities that were presented during the final PD session in June of 2018. Each team was assigned a specific unit (genetics, muscle biology, microbiology, or nutrition) to focus their efforts.  The overall purpose of this activity was to help life science teachers learn how to develop their own inquiry-based learning activities and share their activities with a broader audience.

Data Collection

Quantitative methods were used to determine the change in teachers’ science teaching efficacy by using a modified science teaching efficacy scale (based on Enochs & Riggs, 1990). The instrument used for data collection was created by Enochs and Riggs (1990) to measure the self-efficacy of science teachers, called the Science Teaching Efficacy Belief Instrument (STEBI). Additionally, the data collected for this study was part of a larger data set.

The STEBI consisted of 23 questions scaled from 1 (strongly disagree) to 5 (strongly agree). Terminology was adjusted by researchers to accommodate for high school teachers instead of preservice elementary science teachers. Example questions from Enochs and Riggs (1990) include “I will continually find better ways to teach science,” “The inadequacy of a student’s science background can be overcome by good teaching,” “The low science achievement of some students cannot generally be blamed on their teachers,” and “When a low achieving child progresses in science, it is usually due to extra attention given by the teacher.”

The STEBI (Enochs & Riggs, 1990) is comprised of two scales that measure the constructs personal science teaching efficacy (PSTE) and science teaching outcome expectancy (STOE).

All items use a 5-point rating scale (1 = strongly disagree to 5 = strongly agree). The following item was modified from Enochs and Riggs (1990) by removing the word elementary: “I understand science concepts well enough to be effective in teaching elementary science.”

Additionally, Enochs & Riggs (1990) stated reliability analysis produced Cronbach’s alpha coefficients of .90 for PSTE and .76 for STOE. Post-hoc reliabilities for PSTE and STOE were .799 and .732, respectively. These measures of internal-consistency are acceptable given the nature of the constructs and present reliabilities on comparable measures (Ary et al., 2014).

Data Analysis

Data were analyzed using IBM SPSS version 20. Descriptive statistics (i.e., frequencies, percentages, and means) were used to describe the science teaching efficacy data. Additionally, based on Haynes and Stripling (2014) and Dossett et al. (2019), low, moderate, and high self-efficacy was defined as 1.00 to 2.33, 2.34 to 3.67, and 3.68 to 5, respectively. Data was summarized using descriptive statistics (i.e., frequencies, percentages, and means). Paired samples t-tests were utilized to determine if a significant difference existed in science teaching efficacy and outcome expectancy (OE).

The STEBI contains 23 items in the survey and 13 are designed to address science teachers’ level of belief that they can teach science (Personal Science Teaching Efficacy or PSTE) and 10 assess the respondents’ belief that their teaching will have a positive effect on the students they are teaching (Science Teaching Outcome Expectancy or STOE). Paired t-tests were run on the pre and post survey scores for the PD. The PSTE and STOE section, scores were analyzed separately. Therefore, all analyses of group mean differences were done as two tailed tests.

Results/Findings

The first and second objectives were to investigate the level of PSTE/STOE of the professional development participants before and after the PD. During the first phase of the study teachers reported before the PD, they had a mean personal science teaching efficacy (PSTE) score of 3.83 (SD = .27) and an outcome expectancy (OE) of 3.35 (SD = 0.48). The second phase conducted after the 12-month PD teachers reported an increase in both areas with a mean PSTE of 3.95 (SD = 0.33) and an OE of 3.47 (SD = 0.47).

Means and analysis results for the surveys are presented in Table 1 and Table 2. Analysis of surveys from the PD indicated no significant pre/post shifts on PSTE or STOE scores, however there were small actual mean differences.

Table 1

Personal Science Teaching Efficacy Scores 

LowModerateHigh
MSDf%f%f%
Pretest3.830.2700.0330.0770.0
Posttest3.950.4800.0110.0990.0
Note. 1.00 to 2.33 = low efficacy, 2.34 to 3.67 = moderate efficacy, 3.68 to 5 = high efficacy.

Table 2

Science Teaching Outcome Expectancy Scores 

  LowModerateHigh
 MSDf%f%f%
Pretest3.350.4800.0660.0440.0
Posttest3.480.4700.0660.0440.0
Note. 1.00 to 2.33 = low efficacy, 2.34 to 3.67 = moderate efficacy, 3.68 to 5 = high efficacy.

The mean differences between the pre and post teaching efficacy scores for PSTE and STOE are in Table 3. Analysis revealed a .11-point increase in PSTE, a .13-point increase in the STOE. However, the mean differences were not statistically significant. Thus, the null hypotheses were not rejected.

Table 3

Summary of Paired Samples t tests

 Mean differenceSDSEtp
PSTE posttest – pretest.11.20.061.79.11
STOE posttest – pretest.13.51.16.79.45

Conclusions/Recommendations/
Implications

The purpose of administering the modified STEBI (based on Enochs & Riggs, 1990) was to investigate teachers’ level of science efficacy in the agricultural education and science classrooms and compare the results as the teachers progressed through the professional development.Personal science teaching efficacy (PSTE) slightly increased from pre and posttest and science teacher outcome expectancy (STOE) also changed during the PD.

Analysis revealed a .11-point increase in PSTE, and a .13-point increase in STOE. However, the mean differences were not statistically significant. Thus, the null hypotheses were not rejected. Results of this study indicate that the Increasing Scientific Literacy through Inquiry-Based Professional Development program may be used as a tool to increase PSTE and STOE in life science teachers. Professional development opportunities focused on teaching science through inquiry-based learning could be a way to increase science efficacy (SE) and outcome expectancy (OE) over time. If professional development workshops could continually increase SE and OE, the SE and OE could be used to help determine teacher success in a science-based classroom, thus aligning with Stripling and Roberts’ (2013) assertion that OE and SE can be used to determine teacher success. Teacher educators should purposefully design teacher professional development programs to allow teachers to practice their science teaching skills, thus providing an opportunity for the teacher to increase their SE and OE. To align with Kolb (1984), the professional development should be designed to have purposeful reflection activities that allows the teachers to critically examine their ability and confidence when teaching science concepts.

We found life science teachers in this study to be moderately efficacious in their ability to teach science concepts before and after the conclusion of the PD. However, 20% of the life science teachers in this study moved from moderate to high efficacy with PSTE. According to Bandura (1997), self-efficacy influences behavior. Thus, theoretically, being highly efficacious in PSTE should positively impact the teaching of contextualized science in school-based agricultural education and science programs; on the other hand, being moderately efficacious may negatively impact the teaching of contextualized science. Additionally, educating life science teachers in technical science content aligns with Ballou and Podgursky, 1999, Ma, 1999, and Podgursky, 2005 assertion that teachers content knowledge impacts student learning. Therefore, we recommend the continuation of professional development programming that aims to increase technical content knowledge. Providing in-depth technical content knowledge should allow the teachers to increase their confidence because they will have a better understanding of the technical content and will feel more comfortable teaching the technical content in the classroom. It is important to note that the small sample size limits the generalizability of the findings.

Future research should be conducted to determine why approximately an equal number of teachers are moderately or highly efficacious in PSTE and determine if moderate self-efficacy negatively impacts the teaching of contextualized science. In regard to science teaching outcome expectancy, a majority of the life science teachers were moderately efficacious in STOE. Theoretically, being moderately efficacious in STOE may negatively impact the teaching of contextualized science. The said research will also aid the planning of professional development for agricultural education and science teachers and can be used to guide experiences offered in agricultural and science teacher education programs.

References

Armor, D., Conroy-Osequera, P., Cox, M., King, N., McDonnel, L., Pascal, A., Pauley, E., & Zellman, G. (1976). Analysis of the school Preferred readiness programs in selected Los Angeles minority schools (R-2007-LAUSD). Rand Corp.

Ary, D., Jacobs, L. C., Sorensen, C. K., & Walker, D. A. (2014). Introduction to research in education (9th ed.). Wadsworth.

Ashton, P., Webb, R., & Doda, C. (1983). A study of teachers’ sense of efficacy (Final Report, Executive Summary). Gainesville: University of Florida.

Ballou, D., & Podgursky, M. (1998). The case against teacher certification. The Public Interest.

Bandura, A. (1977). Social learning theory. Prentice Hall.

Bandura, A. (1997). Self-efficacy: The exercise of control. W. H. Freeman.

Berman, P. & McLaughlin, M. (1977). Federal Programs supporting educational change: Vol. 7. Factors affecting implementation and continuation (R-1589/7-HEW). Rand Corporation.

Brookover, V. B., Schweitzer, J. J., Schneider, J. M., Beady, C. H., Flood, P. K., & Wisenbaker, J. M. (1978). Elementary school social climate and school achievement. American Educational Research Journal, 15(2), 301-318.

Brophy, J. & Evertson, C. (1981). Student characteristics and teaching. Longman.

Dossett, J., Stripling, C. T., Haynes, C., Stephens, C. A., & Boyer, C (2019). Mathematics efficacy and professional development needs of Tennessee agricultural education teachers. Journal of Agricultural Education, 60(4), 255-271. https://doi.org/10.5032/jae.2019.04255

Enochs, L. G., & Riggs, I. M. (1990, April 8–18). Further development of an elementary science teaching efficacy belief instrument: A preservice elementary scale. [Paper presentation].

National Association for Research in Science Teaching, Atlanta, GA, united States.

Graham, S., & Weiner, B. (1996). Theories and principles of motivation. Berliner.

Gusky, T. R., & Passaro, P.D. (1994). Teacher efficacy: A study of construct dimensions. American Educational Research Journal,31, 627-643.

Keys, C. W., & Bryan, L. A. (2001). Co-constructing inquiry-based science with teachers: Essential research for lasting reform. Journal of research in science teaching, 38(6), 631- 645. https://doi.org/10.1002/tea.1023

Knobloch, N. A. (2006). Exploring relationships of teachers’ sense of efficacy in two student teaching programs [Electronic Version]. Journal of Agricultural Education, 47(2), 36-47. https://doi.org/10.5032/jae.2006.02036

Knobloch, N. A., & Whittington, M. S. (2003). Differences in teacher efficacy related to career commitment of novice agriculture teachers. Journal of Career and Technical Education, 20(1), 87-98. https://doi.org/10.21061/jcte.v20i1.625

Kolb, D. A. (1984). Experiential Learning: Experience as the Source of Learning and Development. Prentice Hall. 

Ma, L. (1999). Knowing and teaching elementary mathematics: Teachers’ understanding of fundamental mathematics in China and the United States. Lawrence Erlbaum Associates.

Maehr, M., & Pintrich, P. R. (1997). Advances in motivation and achievement (Vol. 10). JAI Press.

Meece, J. L., Anderman, E. M., & Anderman, L. H. (2006). Classroom goal, structure, student motivation, and academic achievement. Annual Review of Psychology, 57, 487-503. http://doi.org/10.1146/annurev.psych.56.091103.070258.

National Research Council. (2000). Inquiry and the national science education standards: A guide of teaching and learning. National Academy Press.

Nebraska Department of Education. (2022). Launch Nebraska- Science. https://www.launchne.com/20-21/covid-19-special-report/.

Nebraska Department of Education. (2017). Nebraska State Accountability (NeSA)- Science. http://nep.education.ne.gov/State?DataYears=20162017.

Podgursky, M. (2005). Teaching licensing in U.S. pubic schools: The case for age simplicity and flexibility. Peabody Journal of Education, 80, 15-43.

Stripling, C. T., & Roberts, T. G. (2013). Investigating the Effects of a Math-Enhanced Agricultural Teaching Methods Course, Journal of Agricultural Education, 54(1), 124–138. https://doi.org/10.5032/jae.2013.01124

Soodak, L. C., & Podell, D. (1996). Teacher efficacy: toward the understanding of a multi-faceted con- struct. Teaching and Teacher Education, 12(4), 401-411.

Pintrich, P. R., & Schunk, D. H. (1996). Motivation in education: Theory, research, and applications. Merrill/Prentice Hall.

Haynes, J. C., & Stripling, C. T. (2014). Mathematics Efficacy and Professional Development Needs of Wyoming Agricultural Education Teachers. Journal of Agricultural Education55(5), 48-64. http://doi:10.5032/jae.2014.05048

Stripling, C., Ricketts, J. C., Roberts, T. G., & Harlin, J. F. (2008). Preservice agricultural education teachers’ sense of teaching self-efficacy. Journal of Agricultural Education, 49(4), 120-130. http://doi:10.5032/jae.2008.04120

Whittington, M. S., McConnell, E. A., & Knobloch, N. A. (2003). Teacher efficacy of novice teachers in agricultural education at the end of the school year. Proceedings of the 30th Annual National Agricultural Education Research Conference, Orlando, FL, 204-215.